Where Is the Homeownership Rate Headed? Examining the Implications for New Housing

Introduction
The homeownership rate, after falling precipitously from 2005 to 2015, has begun gradually trending upwards, from 63.8% in 2015 to the current 64.2%. Increases in the homeownership rate have a positive relationship with new-home demand, but data suggest that continued increases in the rate will be moderate at best.
The homeownership rate peaked in 2004 at 69.2%, fell dramatically with the burst of the housing bubble and the Great Recession, and finally bottomed out at 62.9% in 2016—a level not seen since 1965. The latest homeownership rate (January 2018) of 64.2% is not much higher than Q4 2016 (63.7%) or Q3 2017 (63.9%), indicating that the rate is leveling out fairly close to the long-term average of 65% (1965 through 2017). In this analysis we examine where the rate is likely to go from here; the factors that will influence whether or not the rate stays flat, trends up again, or resumes its 2005-2015 decline; and what that means for new for-sale housing development opportunities.
Prior to the 1950s, fewer than one-half of American households owned their own home. Pro-homeownership government policies played a role in driving up the rate of homeownership in the 1930s with the creation of agencies like the Federal Housing Administration, insuring 30-year loans, and, later, the Federal National Mortgage Association, Fannie Mae, which enables lenders to replenish capital by selling their mortgages to make more loans. Later, the income tax mortgage interest deduction also played a role in encouraging owning over renting. But it took a combination of public policy and social and demographic shifts over many decades to make the U.S. into a majority-homeowning society. The same level of government policy support is not guaranteed in the future, as indicated by the recent tax law changes with caps on deductions and much higher standard deductions, and the still somewhat uncertain future of the government-sponsored enterprises Fannie Mae and Feddie Mac. These changes, along with the fact that substantially more housing priced above $300,000 and much less under $300,000 is being built, are a few of the factors inhibiting future growth in the national homeownership rate.
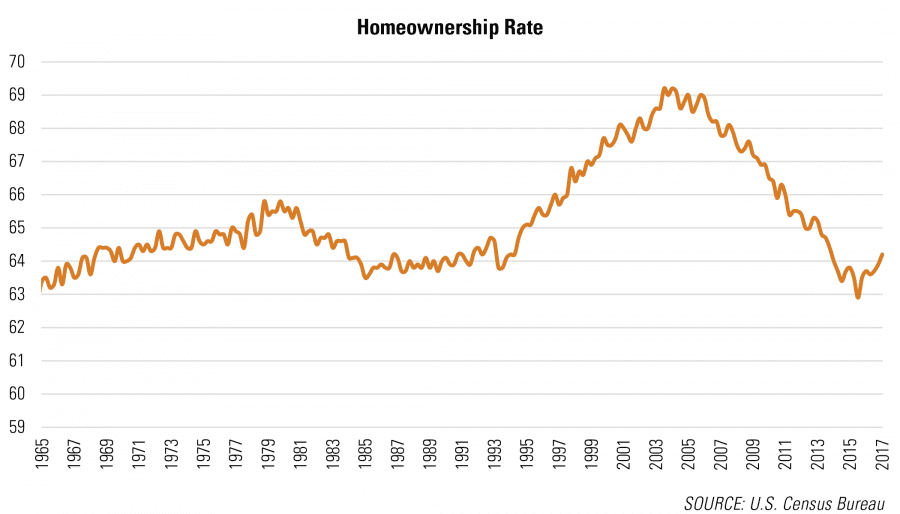
Homeownership rates increased steadily from 1965 to 1980, during the Johnson and Nixon eras, and then decreased throughout the 1980s during the Reagan and Bush I eras. Due in part to historically high interest rates, and substantial growth in the number of young, non-family households compared with family households, homeownership rates fell in the 1980s, as non-family households own homes at lower rates than family households.
The 10-year period from 1994 to 2004 saw the greatest historical increase in homeownership. Under both Clinton and Bush II, federal housing policy goals focused on pushing homeownership rates higher, and addressing the gaps between White and minority rates of homeownership. This, along with low interest rates, more relaxed standards for mortgage qualification, and fervor for housing as an investment, drove homeownership rates to their historical peak levels—69.2% in 2004. That, of course, proved to be unsustainable, which was a key cause of the financial market meltdown in 2007 that in turn contributed to dramatic homeownership rate drops. Millions of homeowners lost their homes in foreclosures, and many more got stuck with mortgages worth more than their homes.
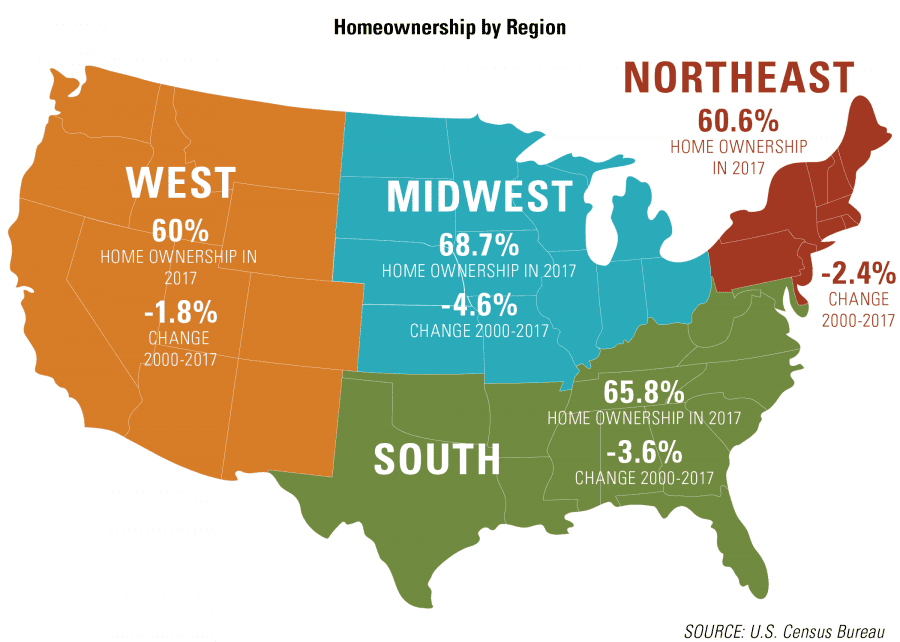
The declines in homeownership occurred in every region of the country, though most sharply in the Midwest, the area with the highest homeownership rate, and less dramatically in the West and Northeast, the areas with the lowest homeownership rates. The South is the only region with more homeowners now than in 2006.
Homeownership Variations across Demographic Segments
To anticipate where homeownership is headed in the future, it is important to recognize that changes in the rate of homeownership have varied dramatically by household type, age, and ethnicity. Given the demographic changes underway, this has significant implications for future homeownership rates.
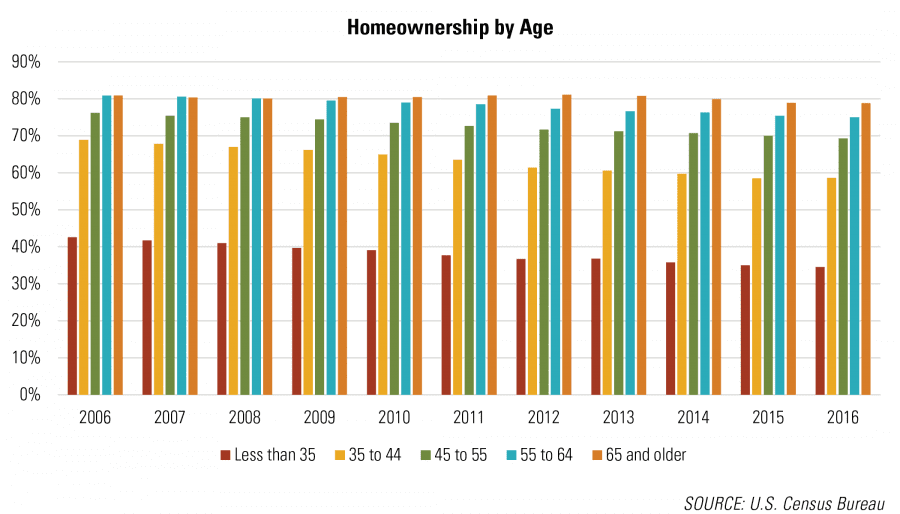
The future growth of homeownership, and therefore the demand for new for-sale housing, depends substantially on the industry’s ability to reach younger, less affluent households who have yet to join the ranks of homeowners. Households under age 45 represent less than a third of total homeowners. Households age 65 and older represent almost a third of all owners, with 78% of 65+ households owning rather than renting. Homeownership rates declined in all household age ranges following the burst of the housing bubble and the Great Recession, with the sharpest declines among those aged 35 to 44. The number of homeowners fell by nearly eight million between 2006 and 2015.[1] But for households age 65+, the rate of homeownership changed very little. This is one reason builders increased their focus on that segment of the market, including bringing an increasing number of active adult communities to market. Although boomers are not growing the overall market like they used to, they are still the households with the most discretionary income for new-home purchases.
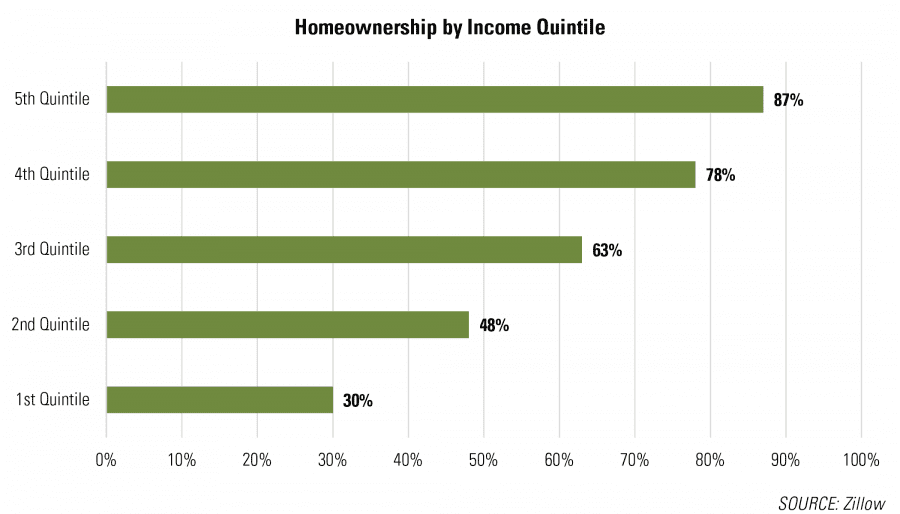
The younger people making up the largest share of the growth in new households have less in the way of resources with which to purchase new housing, and the industry for a variety of reasons has for the most part not focused on delivering entry-level housing. Homeownership rates vary widely across income levels, with 87% of households in the top 20% income range owning their homes, as compared with only 30% of households in the lowest income quintile. Modest-income segments represent an opportunity to expand the ranks of homeowners. However, in addition to the inherent challenges associated with lower incomes and the related difficulty of saving for down payments, higher credit standards put in place following the Great Recession are also an inhibitor for many.
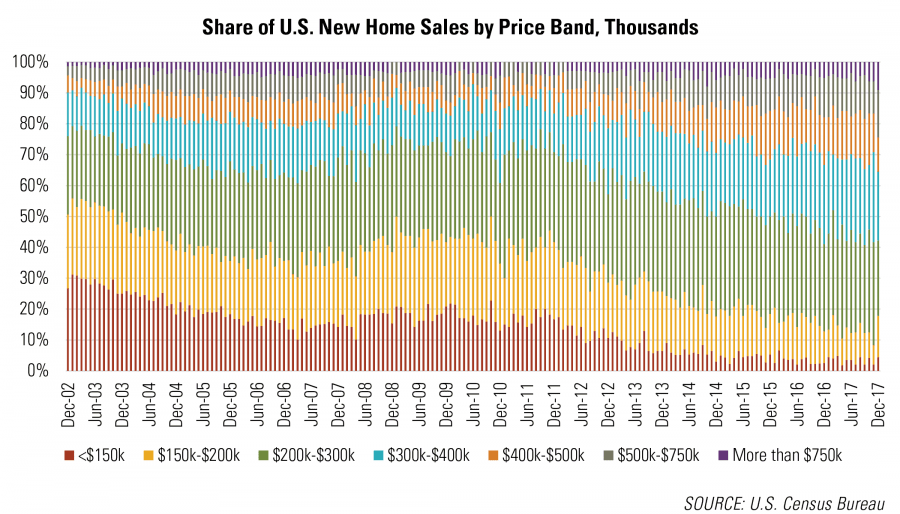
Beyond the overall lower pace of construction activity compared with pre-recession levels, new housing construction since 2010 has been increasingly concentrated in the top segments of the market. The share of new homes priced $300,000 and above has increased from approximately 20% of the market in 2002, to nearly 56% in 2017. The number of new homes sold for $300,000 or more has also increased in absolute terms, jumping by nearly 80% to 340,000 units.
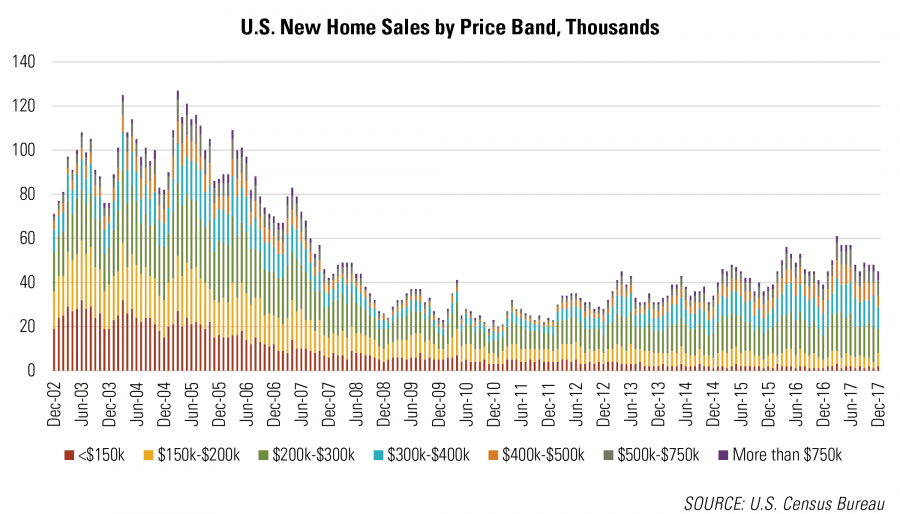
Conversely, the construction of new homes priced below $300,000 has decreased dramatically both as a share of the overall market and in absolute terms. Homes in this price range accounted for 80% of the market in 2002 but only 44% in 2017, while the actual number of homes constructed fell from 783,000 to 270,000.
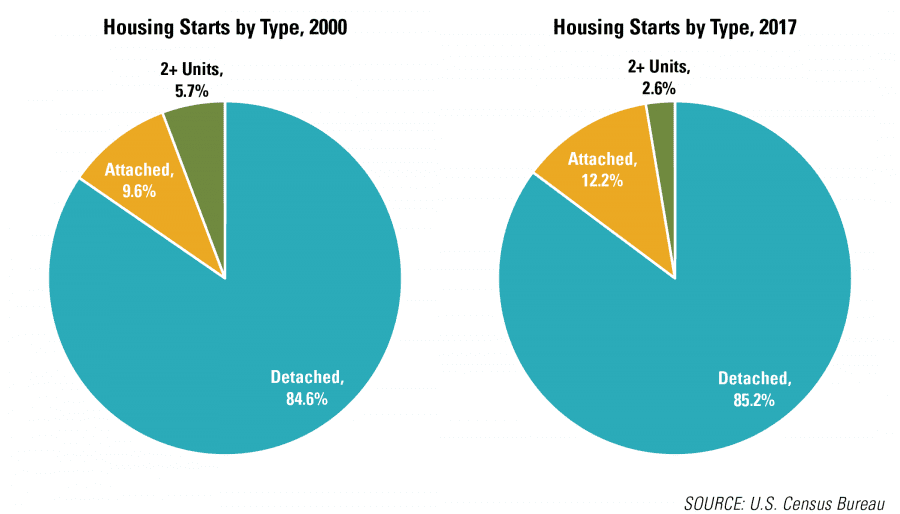
Just as homebuilding has shifted toward higher-priced homes, the types of homes constructed remains heavily skewed toward traditional single-family homes, despite an increasingly diverse household mix. In 2017, single-family detached homes made up 85.2% of new for-sale residential construction, about the same as the 84.6% share in 2000. The share of single-family attached construction registered a modest jump over this time frame from 9.6% of new construction to 12.2%.
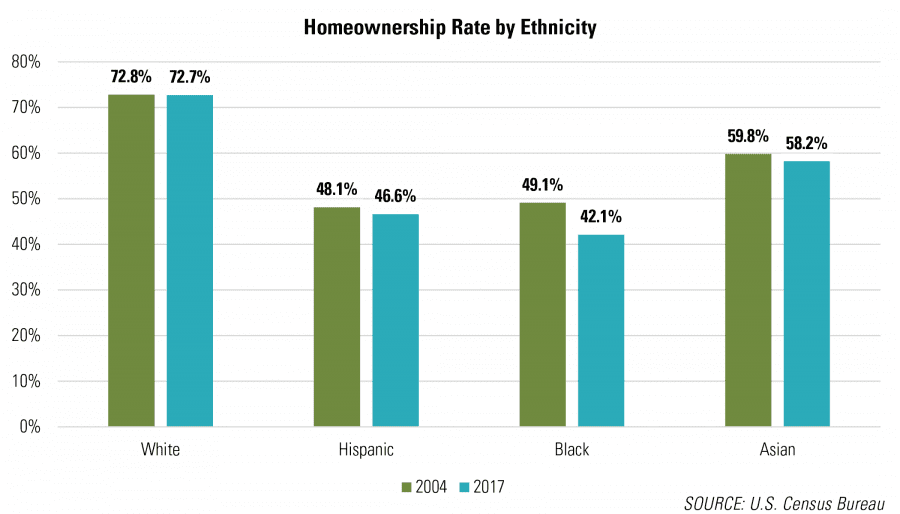
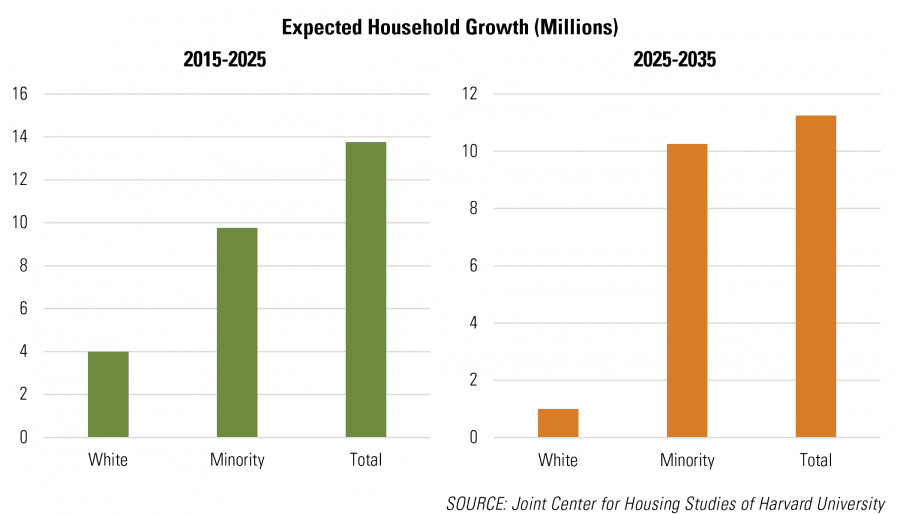
The fact that household formations are more diverse now than in the past has a strong influence on the trajectory of the homeownership rate. Non-Hispanic White households have by far the highest rates of homeownership, while Black households, at 42.1%, have the lowest rate. The share of Black households that own versus rent fell by 7.0% between 2004 and 2017, the largest percentage drop of the major ethnic groups. However, that does not tell the whole story. The number of minority homeowners increased by 3.9 million from 2004 to 2017 (with most of the increase accounted for by Hispanic and Asian households, whose absolute numbers increased dramatically during this period), representing 42.4% of household growth. Moving forward, minorities are expected to account for nearly 75.0% of household growth through 2025.[2]
Minority households are still much less likely to own their home than White households, but the number of minority households who own versus rent is growing. For example, in 2000, Hispanic households only accounted for 6.0% of U.S. homeowners; by 2017 that had grown to 8.7%, an increase of 2.7 percentage points. Capturing a larger share of these growing market segments requires builders to adapt product and marketing strategies to meet the needs of these market audiences.
Demand for New Housing and the Homeownership Rate
Future increases in the homeownership rate, and therefore overall housing demand, will depend in part on the response of the industry to the affordability needs of new households coming into the market. The fact that they are younger and less traditionally “families with kids” suggests opportunities for further diversification from conventional single-family, or at least a greater emphasis on smaller-lot single-family homes, at more attainable prices.
Generational Demand
The youngest millennials have only begun their first post-college employment, but millennials are already the leading group of homebuyers, accounting for 34% of new and resale home sales.[3] They are slightly more likely to buy a resale than a new home, due to where they want to live and what they can afford, but the majority live in the suburbs and the majority who buy rather than rent housing buy in the suburbs. Large numbers of millennials, the oldest of whom will turn 37 this year, are entering a prime homebuying phase of their lives. Although millennials are postponing marriage and kids compared with previous generations, in the next five years 64% of them plan to marry and 55% plan to have children.[4] As these millennials pair off and form new households, they will increasingly turn to homeownership. In fact, millennials have recorded the largest recent increases in homeownership rates among age groups, jumping by 1.3 percentage points during 2017 to 36.0%.
The sheer number of millennials entering the stage of life when homeownership becomes a higher priority will continue to boost for-sale housing demand, but the impact on the new-housing market will depend on the prices and products offered. Currently, millennial demand for housing is strongest for entry-level product delivered at lower price points. Years spent in rentals, which has now become more expensive than homeownership in many major metropolitan areas, has made it difficult for many millennials to save for a large down payment. At the same time, millennials are also dealing with high levels of student debt, which for many diminishes their ability to make mortgage payments.
The smaller average size of millennial households suggests greater opportunities for higher-density housing product types, such as small-lot single-family homes, townhomes, live/work units, bungalow courts, duplexes, and triplexes. In many locations these housing types have lower prices than detached units on larger lots, making them attractive to younger, less-affluent homebuyers.
Households in their mid-30’s to mid-40’s were the hardest hit following the recession and accounted for more than their fair share of the decline in homeownership, but the most affluent Generation Xrs have been some of the master-planned community sector’s best customers. Their circumstances continue to improve due in part to strong home price appreciation, and they are another important segment for builders to focus on. There is some room for increase in this age group’s homeownership rate, but probably not enough to drive the overall homeownership rate above the historical average.
At the older end of the age spectrum, baby boomers will continue to drive demand for new retiree-targeted housing products, but they will not do much for the overall homeownership rate because the vast majority already own homes. Over the next several years, the number of households over the age of 65 is projected to increase by 11.3 million. As a result, approximately one in every three households will fall into this age group by 2035. As boomers age and many choose to downsize, they are generating demand for smaller, maintenance-free housing, another factor supporting greater diversity of housing than is currently being supplied. Many boomers want to shed their larger homes and find something with less than 1,900 square feet of living space, primarily in suburban areas and small towns.
Construction Activity
Although new-home construction activity has steadily increased each year since 2011, the number of deliveries still falls well short of the pre-recession peak, suggesting potential pent-up demand for new housing. Housing construction increased each year from 2002 to 2005, peaking at 1,281,000 homes annually. Residential construction entered a steep decline beginning in 2006, and reached a low point in 2011, with only 301,000 new homes delivered to market.
Since 2011, for-sale residential construction has slowly picked up steam as buyers gradually reentered the market. The number of new homes sold has increased by a compound annual growth rate of 12.4%, reaching a 10-year high of 610,000 units in 2017. Despite these recent gains, this equates to less than half of the 2005 peak. While the 2005 market was overheated and oversupplied, it is likely that the market is currently undersupplied. Higher land and construction costs, the result of labor shortages and stricter regulatory and financing requirements, are most often cited for the decrease.
Where Is the Homeownership Rate Headed?
Despite strong employment, incomes for the most part are only growing modestly, and the housing industry has focused more on the upper end of the price spectrum. Broader price and product innovation, especially at more attainable price points, could spark increases in overall homeownership rates. Otherwise, the demographic composition of household growth, along with the industry focus on more expensive housing, suggest that the homeownership rate is likely to stay below 65% for the time being. Nonetheless, the demand for for-sale housing remains strong, and the underserved segments highlighted in this Advisory represent real opportunities for enterprising builders and developers.
Article and research prepared by Gregg Logan, Managing Director, and Morgan Zollinger, Senior Associate.
References
[1] Demographics of the U.S., Trends and Projections, by Cheryl Russell, New Strategist Press, 5th Edition, 2017
[2] The State of the Nation’s Housing (2017), Joint Center for Housing Studies of Harvard University
[3] Home Buyer and Seller Generational Trends Report 2017, National Association of Realtors
[4] Millennials and Their Homes: Still Seeking the American Dream, Demand Institute
Disclaimer: Reasonable efforts have been made to ensure that the data contained in this Advisory reflect accurate and timely information, and the data is believed to be reliable and comprehensive. The Advisory is based on estimates, assumptions, and other information developed by RCLCO from its independent research effort and general knowledge of the industry. This Advisory contains opinions that represent our view of reasonable expectations at this particular time, but our opinions are not offered as predictions or assurances that particular events will occur.
Related Articles


Speak to One of Our Real Estate Advisors Today
We take a strategic, data-driven approach to solving your real estate problems.
Contact Us