Re-Painting the Picket Fence: A New Definition and Interactive Map of Suburbia
Do you live in a suburb? For many Americans, the answer to this question is a resounding “yes”! In our 50 largest metropolitan areas, 79% of people live in the suburbs, as do nearly three-quarters of Millennials, many of whom are actively choosing suburban living over the hustle and bustle of city life. Further, most jobs and much of the job growth is located in the suburbs as well. While we have been focused on the very real and exciting revitalization of America’s urban places, we have stopped talking about the dominant place type in American life, which is still an area of great real estate opportunity.
What Do We Know about The Suburbs?
In a just-released ULI report titled Housing in the Evolving American Suburb, RCLCO worked with the ULI Terwilliger Center for Housing to re-orient the discussion around suburbs, to focus on their unique challenges and opportunities. For the purpose of this report, RCLCO therefore developed a new way to analyze suburbs.
This methodology takes into account the fact that, for many Americans, the word “suburb” is very much tied to housing. As such, RCLCO created a housing-focused approach to classifying suburban neighborhoods, considering factors such as density, housing type, home value, and proximity to downtown. Using this classification system, RCLCO determined that, despite recent urban growth, the suburbs continue to be profoundly important.
To view the interactive version of the suburb atlas that shows the classification of the top 50 metro areas, please click here.
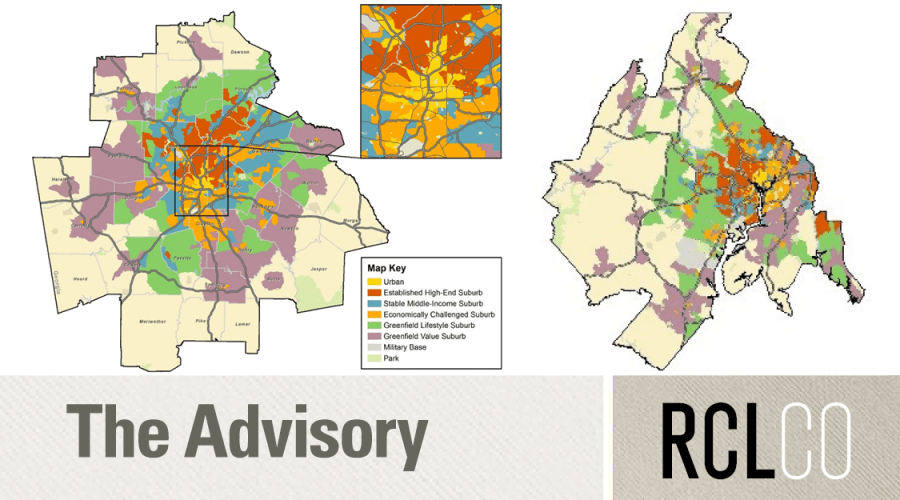
Classification of the Suburbs; Atlanta-Sandy Springs-Roswell, GA MSA
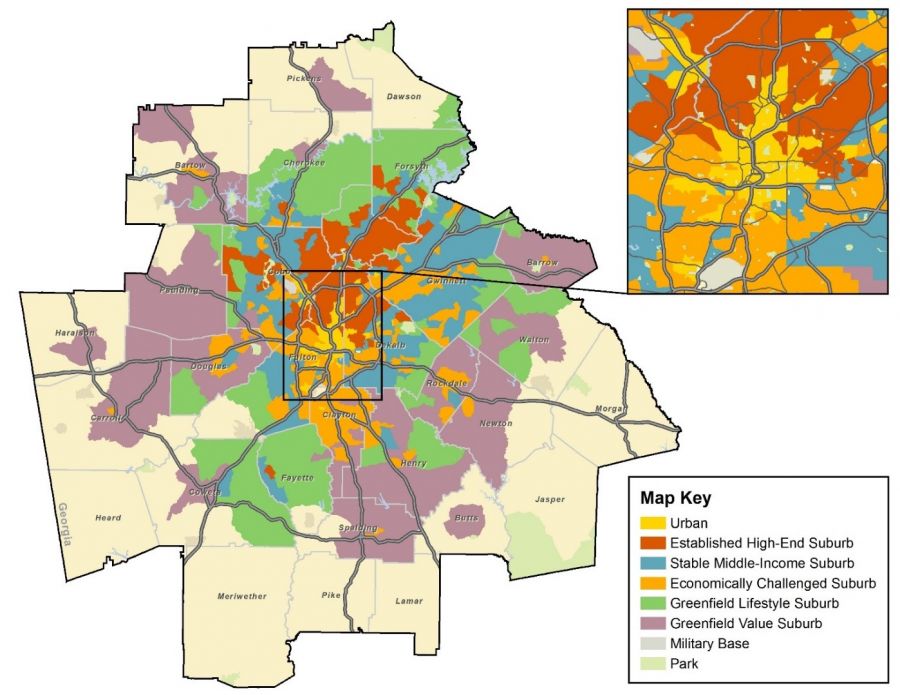
SOURCE: RCLCO
Key Findings
- America remains largely a suburban nation. In the 50 largest (and most urbanized) metropolitan areas, suburbs as defined here account for 79% of the population, 78% of households, and 32% of the land area.
- Suburban growth has driven recent metropolitan growth. From 2000 to 2015, suburban areas accounted for 91% of population growth and 84% of household growth in the top 50 metro areas.
- The large majority of Americans work in suburbs, although job growth has been more balanced between suburbsand cities recently. As of 2014, 67.5% of employment in the 50 largest metro areas was in suburbs. Between 2005 and 2010, employment in suburban areas remained stagnant with zero growth, while it increased by 8.0% in urban areas. But between 2010 and 2014, the number of jobs increased by 9.0% in suburbs, compared with 6.0% in urban areas.
- Suburban residents overall have higher incomes. The median household income in suburbs ($71,000) is substantially higher than in urban areas ($49,200). In addition, 88% of 35- to 54-year-olds with incomes above $75,000 live in the suburbs (compared with 77% of those with incomes less than $75,000). And 90% of those between ages 55 and 74 with incomes of $75,000 or more live in the suburbs (compared with 80% of those in this age range with lower incomes).
- The suburbs are “young” compared with their regions overall. Fully 85% of children ages 18 and younger and, contrary to popular perception and most media attention, three-quarters of 25- to 34-year-olds, in the 50 largest metro areas live in the suburbs.
|
79%of the population of the 50 largest metros live in a suburban area.
91%of population growth from 2000 to 2015 occured in suburban areas within the 50 largest metros.
$21,800+The difference in median incomes between suburban and urban areas within the 50 largest metros.
75%of 25- to 34-year-olds within the 50 metros live in suburban areas. |
Applications of the Methodology
Because the various types of suburbs will have different housing demand and development opportunities, it is important to understand where they are and how they function. Although the report focuses on national trends in the suburbs, the economic and demographic characteristics of suburban communities vary from one metro area to the next.
One example of these variances can be seen in the average home values of suburban neighborhoods. Just as suburban home values vary by region, they also vary by metro area, especially when one looks at the different types of suburbs. For instance, in the Washington, D.C., metro area close-in (less than 5 miles from downtown) established high-end suburbs have the highest average home values, while in the Indianapolis metro area the suburbs with the highest home values are located much further away (more than 15 miles) from downtown. These differences indicate that homebuyers in and around Washington, D.C. are willing to pay a substantial premium for living close to downtown, while homebuyers in and around Indianapolis may value other location characteristics.
Recognizing the differences that exist between suburban communities has practical applications for both public entities and private developers. While local governments might be interested in the overarching challenges and opportunities in their communities, private developers can benefit from a better understanding of the intricacies and market preferences of the areas in which they operate. As such, it is universally important to recognize that there are a variety of different types of suburbs, and that these suburbs are likely to experience unique forms of development and redevelopment in the years to come.
The traditional suburban archetype—which for many Americans evokes images of places like Wisteria Lane in Desperate Housewives or Stepford in The Stepford Wives—is now outdated. In its place, a new model of suburbia has emerged that is much more diverse, serves a broad range of housing needs and desires, and offers abundant opportunities for a wide variety of new development and redevelopment.
Article and research prepared by Adam Ducker, Managing Director; Erin Talkington, Vice President; and Jake Ross, Associate.
RCLCO provides real estate economics and market analysis, strategic planning, management consulting, litigation support, fiscal and economic impact analysis, investment analysis, portfolio structuring, and monitoring services to real estate investors, developers, home builders, financial institutions, and public agencies. Our real estate consultants help clients make the best decisions about real estate investment, repositioning, planning, and development.
RCLCO’s advisory groups provide market-driven, analytically based, and financially sound solutions. Interested in learning more about RCLCO’s services? Please visit us at www.rclco.com/expertise.
Disclaimer: Reasonable efforts have been made to ensure that the data contained in this Advisory reflect accurate and timely information, and the data is believed to be reliable and comprehensive. The Advisory is based on estimates, assumptions, and other information developed by RCLCO from its independent research effort and general knowledge of the industry. This Advisory contains opinions that represent our view of reasonable expectations at this particular time, but our opinions are not offered as predictions or assurances that particular events will occur.
Related Articles


Speak to One of Our Real Estate Advisors Today
We take a strategic, data-driven approach to solving your real estate problems.
Contact Us