Top 10 Megapolitan Regions Gaining Market Share
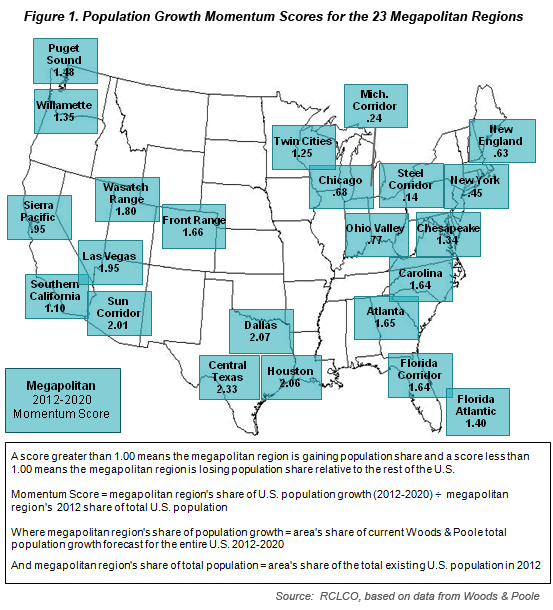
In this Advisory we examine the regions in the U.S. that are likely to achieve the greatest growth momentum as a key measure of their vitality and attractiveness for development and investment. Regions with the strongest growth momentum are those forecasted to have the highest shares of population and employment growth from 2012-2020 relative to their 2012 population and employment. RCLCO has used that relationship to score each of the 23 megapolitan regions, identifying the 10 areas with the greatest growth momentum. Regions gaining market share have scores greater than 1.00; they are growing and attracting relatively more than their “fair share” of growth. Regions scoring less than 1.00 are losing share, although they are all still projected to grow between 2012 and 2020.
In evaluating real estate markets there is a tendency to focus on short-term market and economic trends—who’s up, who’s down, etc. As many investment and development decisions depend on short-term economic fundamentals, there’s nothing wrong with that approach in many situations. But a longer-term perspective is critical for acquiring, entitling, or disposing of land; developing master-planned communities and resorts; and other long-range real estate activities. Population and employment growth are two very important long-term trends to consider, but just looking at absolute growth and growth rates is insufficient to understanding the real long-term potential of an area. Knowing which areas have growth momentum is an important high-level indication of where real estate opportunities may be strongest. RCLCO also uses this scoring system within megapolitan regions to understand directions of growth.
In their 2011 book Megapolitan America, Arthur Nelson and Robert Lang argue for a new understanding of the emerging economic geography, recognizing that many “urban areas of the United States are linked to each other, often creating systems of metropolitan areas functioning as their own economic engines.” There is a connection between geodemographics and economic growth, with population growth and economic development strongly related to each other over the long run. The Sun Corridor, comprised of the Phoenix and Tucson metropolitan areas, and greater Dallas-Ft. Worth, are well-known examples of these megapolitan regions. The megapolitan regions shown on the maps and tables are clusters of metropolitan areas characterized by the blurring of boundaries between them. This is as a result of their past and present growth and economic linkages. Understanding the future growth trajectory of these megapolitan regions is important to long-term real estate investment decisions, and critical for public sector coordination of investments and policies pertaining to transportation, air quality, and water supply. These 23 megapolitan regions have been, or are predicted to be, the dominant regions for U.S. economic growth. To better understand the degree to which these expectations will hold true this decade, RCLCO analyzed population and employment growth forecasts for the counties that comprise these megapolitan regions, and scored them based on their relative shares of forecasted growth. A complete list of individual counties that comprise each of the megapolitan regions is in the Appendix.
The U.S. population overall is forecasted to increase by as much as 26,000,000 persons between 2012 and 2020. A whopping 70% of this increase is forecasted to occur in the 23 megapolitan regions. But there’s more to the story than that: while all of these areas are expected to grow, some megapolitan regions are expected to gain market share and others to lose share of population and employment growth between 2012 and 2020, which in turn will affect demand for various types of real estate.
A region is considered to be gaining momentum when it is forecasted to capture a greater percentage share of population or employment growth than its percentage share of current population or employment. While it is important to look at how much absolute growth an area is capturing, analyzing which areas have momentum provides a useful indication of which are the “up and coming” regions that growth is likely to continue to shift towards. Measuring momentum is also important because these areas are not always comparable in terms of area, population, or employment. So while the fact that one area is gaining more or less population or employment in absolute terms is important, it may also be in part a function of the size of the area and the number of market areas the megapolitan region contains. Momentum is a measure of the potential for each region to grow stronger and perhaps faster over time.
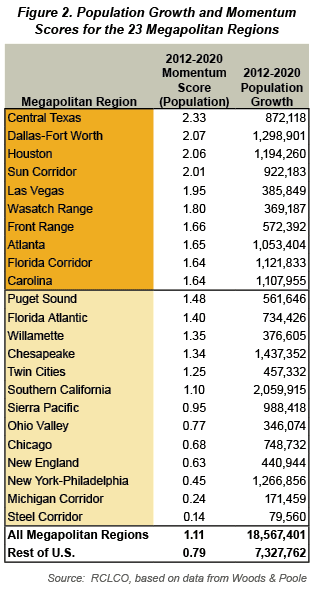 In order to gauge the relative growth momentum of the 23 megapolitan regions, shown on the map and table, RCLCO calculated the degree to which each area is growing by more or less than its fair share, calculating Momentum Scores for population and employment growth for each region. Figure 2 shows the Momentum Scores for each megapolitan region and forecasted absolute population growth.
As shown in Figure 2, all of the areas are growing in absolute terms, but some are capturing more than their “fair share.” As shown on the map and table, 16 of the 23 areas have Momentum Scores greater than 1.00, with four regions forecasted to capture over twice their fair share (a score of 2.00 means twice their fair share).
For example, the megapolitan regions of the energy-rich Texas Triangle are not just experiencing a lot of growth, they clearly have momentum, with all three megapolitan regions expected to gain more than twice their fair share of population growth between 2012 and 2020. Even during the downturn these Texas megapolitan regions remained strong migration destinations as they were not as affected by the broader economic decline. It is also worth noting that these Texas areas enjoy relatively moderate housing costs compared with other parts of the country, which may also be a factor, as indicated by comparing home prices in areas with much lower Momentum Scores, such as the Sierra Pacific (which includes the San Francisco area), New York, and New England. The Phoenix-Tucson Sun Corridor megapolitan region is similarly expected to gain twice its “fair share,” and strong population growth momentum is the main driver behind Phoenix’s revitalizing housing market. Much of that growth is migration coming from high-cost areas in southern California, whose megapolitan regions have much less momentum as indicated by their significantly lower Momentum Scores. The Las Vegas megapolitan region, which similarly to Phoenix was crushed by the bursting of the housing bubble, scores high due to its return to being a strong in-migration destination.
The megapolitan regions with very low Momentum Scores reflect the fact that momentum is not forever; for example, the Michigan Corridor and Steel Corridor megapolitan regions were once among the top growth areas in the country. Their low scores are a reflection of major shifts in the underlying economy, just as the high scores in the Wasatch Range, Front Range, Carolina, Atlanta, and Florida megapolitan regions reflect shifts in the opposite, positive direction. The high-scoring regions are an indication of the geography of current and future growth prospects. There is a relationship between the high Momentum Scores in the Carolina, Atlanta, and Florida megapolitan regions and the low scores in the Midwest and Northeast megapolitan regions, as the high-scoring regions are drawing population from the low-scoring regions.
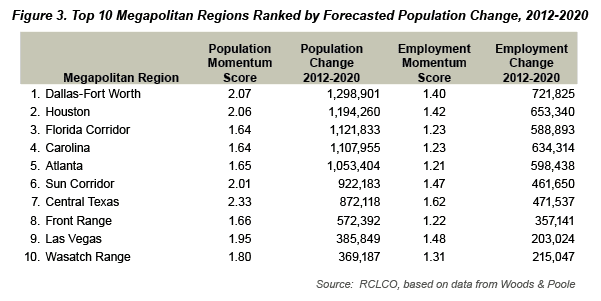
The chart above summarizes the data for the 10 megapolitan regions with the highest population Momentum Scores, ranked by forecasted population growth. Of the top 10 areas, seven are in the West, with the rest in the Southeast. Note that the Florida Corridor benefits from strong absolute population and employment growth, though its Momentum Score for employment growth is lower than many of the other areas (but still higher than the rest of the country). The Florida Corridor is different in that it will continue to benefit from retiree migration from the Midwest and Northeast, helping to revitalize the residential real estate market and create demand for health care and service sector employment. The Wasatch Range is another area with a much stronger population Momentum Score than employment Momentum Score, perhaps a reflection of its much higher birth rate and larger family sizes than other areas of the country, and capacity for further job growth. Meanwhile, the Carolina megapolitan region, one of the country’s largest centers for high-tech and biotech research (Raleigh) and banking and finance (Charlotte), also stands out for its strong growth momentum and strong absolute population and job growth forecast.
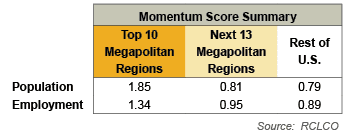 As shown in the Momentum Scores summary table, the top 10 megapolitan regions score 1.85 in terms of population growth, meaning they are expected to capture almost twice their fair share of population, and score 1.34 in terms of employment growth. This compares with the next 13 megapolitan regions, which in aggregate are forecasted to gain less than their fair share, with Momentum Scores of 0.81 (population) and 0.95 (employment). This is particularly because of seven low-scoring regions with population Momentum Scores of less than 1.00. However, there are six regions among the 13, including the Puget Sound, Florida Atlantic, and Willamette regions, that are gaining share, though at lower rates than the top 10. The remainder of the U.S. has aggregate Momentum Scores of 0.79 for population and 0.89 for employment—still growing, but losing market share to the top megapolitan regions.
While it has been generally observed that the long-term trend has been for the fastest-growing megapolitan regions to be located in the West and the South, with slower growth areas in the Northeast and Midwest, it’s clear that the growth is strongest in just a few key megapolitan regions. The Momentum Scores provide a means of measuring the relative strength of that growth potential, reflecting the changes in the underlying economy that ultimately drive demand for real estate.
To view the Appendix, please click here.
1Arthur Nelson and Robert Lang, Megapolitan America, American Planning Association, 2011.
2Forecasters don’t all agree on total 2020 U.S. population; Moody’s Economy.com forecasts an increase of about 20 million, while Woods & Poole projects growth of 26 million; the base data in this analysis is from Woods & Poole.
Article and Research prepared by Gregg Logan, Managing Director, and Steven Wang, Associate.
RCLCO provides real estate economics, strategic planning, management consulting, and implementation services to real estate investors, developers, financial institutions, public agencies, and anchor institutions. Our real estate advisors help clients make the best decisions about real estate investment, repositioning, planning, and development.
RCLCO’s advisory groups provide market-driven, analytically based, and financially sound solutions. RCLCO’s Community and Resort Advisory Group produced this newsletter. Interested in learning more about RCLCO’s CRAG? Please visit us at www.rclco.com/community-and-resort.
Related Articles


Speak to One of Our Real Estate Advisors Today
We take a strategic, data-driven approach to solving your real estate problems.
Contact Us