Competing in a Global Market: 11 U.S. Megaregions and Implications for Real Estate Investors
As investors compete in an increasingly crowded global market place, attention is returning homeward where relatively low pricing and positive job growth look very attractive on a global scale. While a few prime CBDs have garnered the lion’s share of new investments recently, 11 megaregions are emerging in the U.S. Characterized by job-creating industries and improving (yes again!) housing markets, these regions are set to dominate U.S. real estate demand in the next decade. And, some are growing at a similar pace as metropolitan areas in emerging markets—but with much higher income and education levels.
The U.S. megaregions.Regional planners must think decades ahead to develop infrastructure and transportation systems in anticipation of urban growth. Infra- structure investments such as utilities, roads, and public transportation can require billions of dollars and decades of planning. Economic growth, corporate location preferences, and demographic patterns are forecast long in advance. Knowing these patterns and infrastructure plans can provide investors with a useful preview of which regions might perform comparatively well going forward. One such plan is America 2050,1 a national infrastructure planning and policy program by the Regional Plan Association. The program was initiated in 2005 and has published research and policy recommendations regarding the future growth and competitiveness of the United States, particularly in regard to infrastructure planning such as high-speed rail, water, energy planning, and land use.
A major focus of the America 2050 plan is the emergence of 11 megaregions that are expected to encompass most of the U.S. population growth through 2050. While a consistent definition is not used throughout the industry, megaregions are generally defined as large networks of metropolitan areas that are connected by similar environmental systems and topography, linked infrastructure and econo- mies, settlement patterns and land use, and shared culture and history. If managed well, cities that are part of these large agglomerations can benefit from economies of scale, including better matching of labor supply and demand, a wider range of shared services and infrastructure, and proximity to supply chains and similar businesses, all of which should reduce business risk, and increase efficiency and consumer demand.
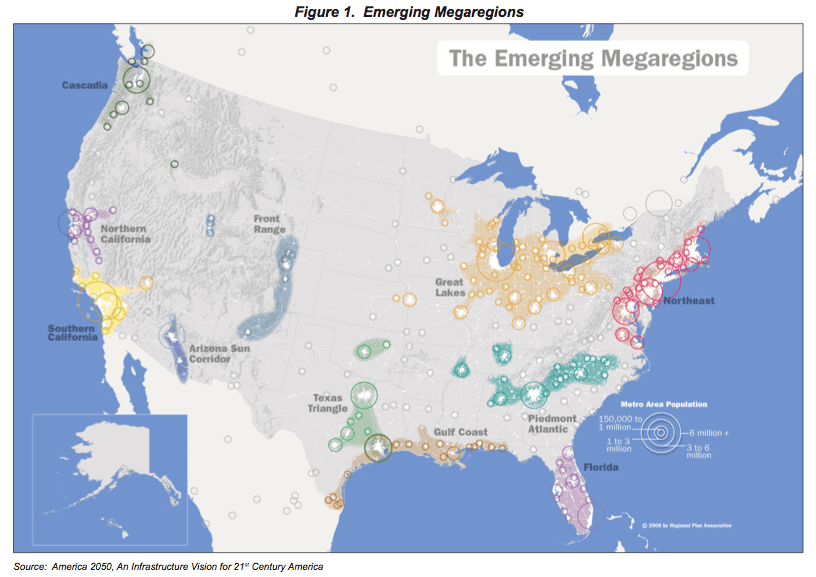
 As shown in Figure 1, the megaregions identified in the plan span the country and include Cascadia (Seattle to Portland), Northern California, Southern California, the Front Range (Denver to Tucson and Salt Lake City), the Arizona Sun Corridor, the Texas Triangle, the Great Lakes, the Northeast, the Piedmont Atlantic (Alabama and Tennessee through Georgia to North Carolina), the Gulf Coast, and Florida. See Appendix 1 for a further description of the megaregions.
As local economies grow, the boundaries of nearby metropolitan areas begin to blur and megaregions start to develop. Infrastructure needs be- gin spanning the jurisdictions of different counties, metropolitan areas, and states (nine of the 11 megaregions span multiple states), creating a need for inter-regional planning. While not every megaregion meets all of the above criteria, metropolitan areas within each megaregion generally share a common proximity and potential need to share common planning goals. Without some cohesiveness in long-term goals, competition among regions can be productive for near-term economic growth but can create volatility and long-term economic and real estate instability.
Why should we care about megaregions? The metropolitan areas in the 11 megaregions identified in the America 2050 plan account for 76% of the U.S. economy and 75% of the working population. The largest of the megaregions—the Northeast and Great Lakes—rank as the fifth and ninth largest economies, respectively, in the world (Figure 2).
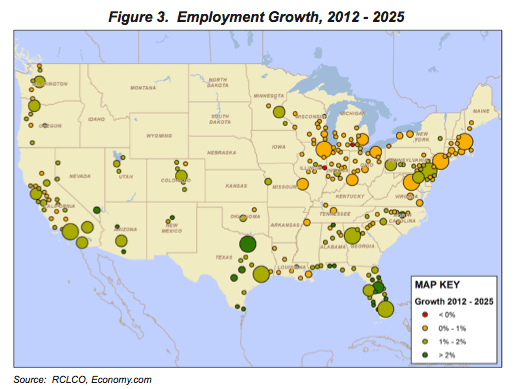
More importantly, going forward, the megaregions are expected to account for 85% of new job growth and nearly all positive population growth through 2025. More than a million new jobs are expected to be created in the New York metropolitan area by 2025, with nearly a million in each of Dallas, Los Angeles, and Houston.2 Office jobs will account for about a third of this growth. Real estate investors are already tuning in to this trend, with 99% of institutional investment in commercial real estate within the 11 megaregions.3
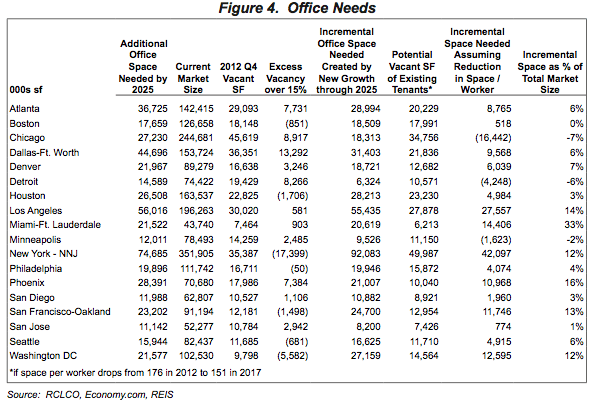
However, changing trends in both internet based consumption patterns and office space usage make it difficult to forecast of long-term office space needs. For example, NAIOP reports that office space per worker is declining rapidly from 225 sf per worker in 2010 to 176 in 2012 and an estimated 151 psf in 2017. In a baseline scenario of moderate U.S. economic growth, if space per worker drops to 151 psf, the incremental growth in these regions will create the need for another 75 msf of new office space in New York, 56 msf in Los Angeles, 45 msf in Dallas and 25 msf or more in Atlanta, Phoenix, Chicago, and Houston. Much of this demand can be accommodated, though, by currently vacant space and by space that will be released by existing tenants if office space per worker drops by another 14% from 176 sf per worker to 151 sf per worker. For example, if we assume a rough long-term average vacancy rate of 15% for office space, including the possibility that some space may become obsolete due to changing needs for environmental issues and floor space needs, the Los Angeles area currently has 581,000 sf of vacant space above the 15% expected long-term vacancy. Another 27.9 msf could be given back by current tenants over the next decade if space usage per worker declines by another 14%. Subtracting these two figures from the 56 msf needed for new employment growth, just 27.6 msf of space will be needed through 2025, or an increase in the market size of 14% (slightly over 1% per year).
While this analysis is extremely crude and sure to change as economic and usage trends play out, it does exemplify the rationalization of large investors who are currently focusing on major markets such as New York, Washington, D.C., and San Francisco, and the need to focus long-term investments in properties and sub-markets that have the infrastructure and amenities to remain relevant through secular changes in the usage of real estate space. However, as the economy improves and occupancy rates rise, it also points out potential opportunities, particularly in some of the higher growth southern markets such as Miami, Phoenix, Atlanta, and Dallas that may be priced more attractively and offer short-term and/or long-term investment opportunities.
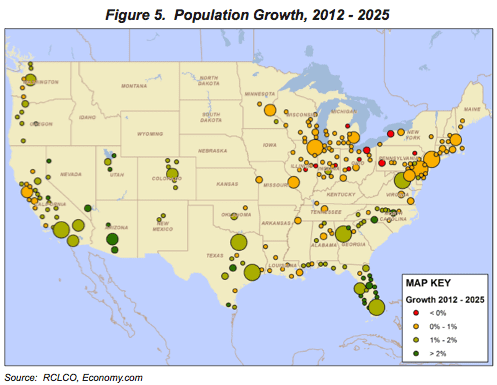
Dallas, Los Angeles, Houston, Phoenix, Miami, and Atlanta are also each expected to be home to 1.5 to 2 million new residents by 2025, with nearly a million new residents in each of Orlando, New York, Washington, D.C., Raleigh, and Riverside. Local markets that are on the periphery of these high growth metropolitan areas—particularly those that are near infrastructure or planned infrastructure—may have a better chance going forward of being in the path of growth. These localities have the potential to change from rural areas to burgeoning suburbs. In fact, in a study of 640 U.S. counties that represent the bottom 20% of counties in terms of average wages and growth in population, wage, and employment, underperformance was generally attributable to less educated and older population bases and higher concentrations of agriculture and manufacturing employment. The 640 counties represented only 5% of the U.S. population base and were overwhelmingly outside of the 11 megaregions, with the exception of the Great Lakes.4
What can we learn from megaregions in other countries? U.S. metropolitan areas are quite small as com- pared to city agglomerations in other countries. Of the 21 city agglomerations that include 10 million people or more, only two are located in the U.S.—New York and Los Angeles. The next largest, Chicago, ranks 25th globally, behind Seoul (Korea), Chongqing (China), and Jakarta (Indonesia).
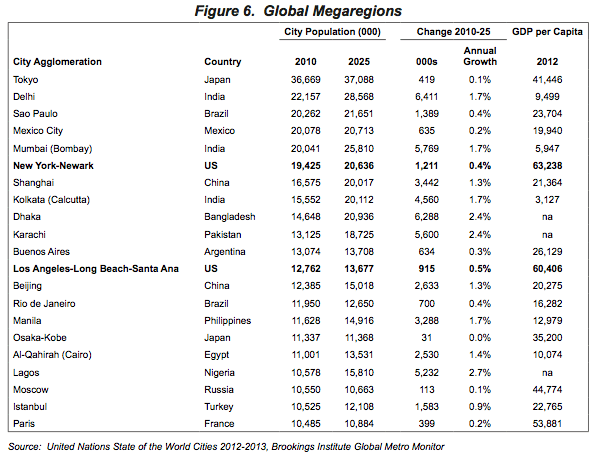
The largest global megaregions are a disperse group of cities ranging from emerging to developed countries and low growth to high growth areas. Growth in terms of number of people is highly skewed to the emerging markets. In fact, the developing market urban population grew by an average of 1.2 million people per week during the past decade, slightly less than the equivalent of a full year’s growth in Europe’s urban areas. Nearly three-fourths of this growth was in Asia and nearly 20% was in Latin America. Half the world’s urban population now lives in Asia and seven of the ten largest megaregions are here. Interestingly, Africa’s urban population is now forecast to outgrow both Europe and Latin America by 2025,5 with the aggregate urban population of Africa, Europe, Latin America, and the Caribbean expected to reach 642 million, 566 million, and 560 million, respectively. Despite the growth, Africa is expected to continue to be the least urbanized region in the world (45% of the population) as compared to Latin America at 80% (the most urbanized region), and Europe at 73%.
The as-of-yet inability of Africa to flourish economically despite large demographic agglomerations in countries such as Nigeria and the Congo brings up the question of why some cities flourish and others do not. Income levels that fund drivers of prosperity such as education and infrastructure are an obvious answer. Wealth is generally associated with more advanced countries that are better positioned to capitalize on agglomeration economies, not only because of wealth but also because they generally already have the legal and financial markets to support growth. Additionally, the lower growth prospects of these countries are easier to manage than the fast and sometimes chaotic growth of emerging markets.
However, some low-income cities are improving their economic status quickly. In a recent study, the United Nations states that there is no clear association between the demographic growth of cities and their levels of prosperity. In fact, population decline in a number of cities in Western Europe, Canada, and New Zealand did not affect living standards, which in some cases even improved. In these areas, the city center remains the dominant driving force behind the regional economy. On the other hand, population declines in a number of cities in Eastern Europe and the U.S. have resulted in significant economic decline as the deterioration of inner cities resulted in population declines.
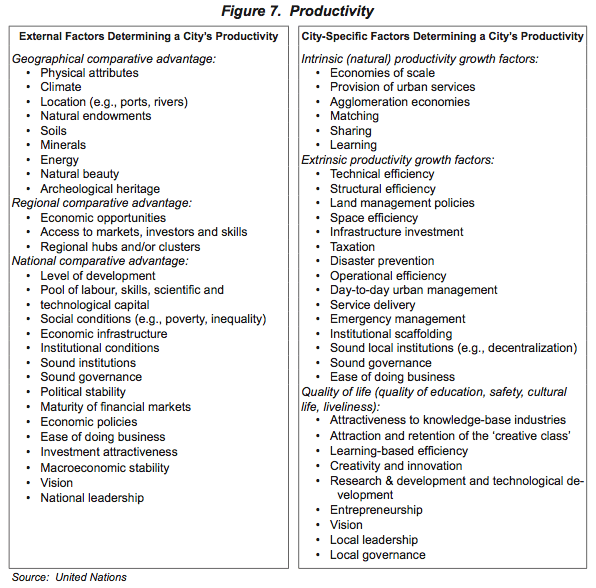
Stability of the national and local government, including issues such as a lack of corruption and enforceable laws that encourage productivity, is another obvious factor in determining the fate of cities. In fact, the United Nations lists both external (regional and national) factors and city-level factors as being important in the productivity of cities (Figure 7). External influences range from physical attributes such as location, climate, and topography to national wealth and development of financial and legal systems. In terms of geography, 14 of the world’s 19 largest cities are port cities, as coastal areas and river deltas often benefit from lower ship- ping costs and access to international markets. Geographic proximity to other larger cities has also spurred the emergence of “city clusters” as second-tier cities near larger metropolitan areas benefit from scale and agglomeration in the area. Examples include Tianjin, Shijiazhuang, and Tangshan, which developed around Beijing; Zhuhai, Dongguan, and Foshan around the provincial capital of Guangzhou; and Suzhou, Wuxi, and Hangzhou near Shanghai. The recent growth in the coastal cities in China has resulted in a difference in per capita fiscal revenues between the richest and the poorest provinces increasing from a ratio of 2:1 to 19:1 by 2008.6
City-specific factors highlight the local infrastructure development, services, and policies that allow businesses to operate in an efficient and productive way. Local governments must effectively manage growth issues such as congestion and rising input prices. A case in point is Mumbai, where attempts to create an international financial hub have been defeated by congested transportation and difficult real estate markets. China, on the other hand, has created an immense amount of infrastructure, including roads, electricity, and water distribution.
So how do the U.S. Megaregions stack up? Maybe not surprising to some, population growth in the Arizona Sun Corridor and Florida is at levels similar to those in many high-growth emerging markets. The Front Range, Texas Triangle, and Piedmont Atlantic regions are also growing quickly. As seen in Figure 8, population growth in these regions is growing at double the U.S. pace and is expected to continue to be strong. Both Florida and Arizona will need to attract younger working populations that can provide services to the large retiree populations that are migrating into the area. While educational attainment and income levels in these areas are some of the lowest in the country, they are certainly well above those seen in emerging market countries.
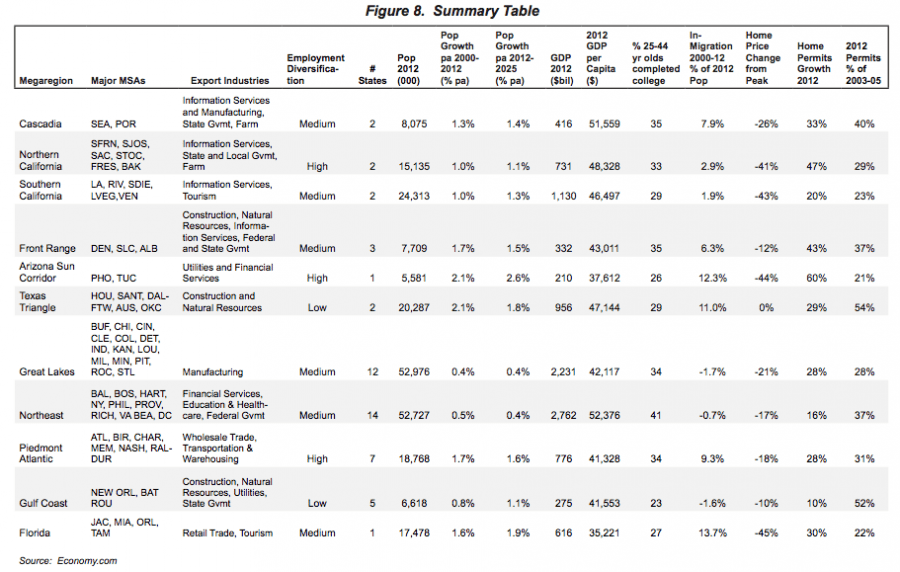
The Cascadia, Front Range, and Piedmont Atlantic regions have strong growth potential within the realm of other global high growth markets throughout the world, yet these regions also offer the advantage of educated and fairly diverse work forces. Of these three, the Piedmont Atlantic region will most challenge local policy makers, as portions of seven states are included in the region. Cities such as Memphis, which is located on the border of three states, represent a particular policy challenge as it is tempting to compete with other states by offering near-term tax incentives to companies to attract jobs. However, tax incentives can introduce volatility into real estate demand and investor interest, particularly when they have an end date. Long-term growth is likely better served by coherent cross-state policies and cooperative planning for infrastructure needs.
The 14 states in the Northeast megaregion are global hubs for finance, the U.S. government, and world-class health and education systems. This region is the wealthiest and also the best educated in the country, which should at least partially counterbalance the slow growth in the region. While California is another high-income area, it has different economic dynamics dominated by a diverse set of industries from technology and government to agriculture. High costs, policy, and deficit issues will continue to restrain growth in the region in the near-term.
The Great Lakes is the largest megaregion in the country, including a dozen large metropolitan areas and portions of 12 states. While there may be some transportation and infrastructure links, it may be best consid- ered as a few smaller megaregions ranging from more agriculture-based economies in the western part of the region to manufacturing in the center and east of the region, and including some more diverse service-based industries. Performance varies both by metropolitan area and by state. For example, Indianapolis, Louisville, Milwaukee, and Minneapolis exhibit stronger growth than the region as a whole.
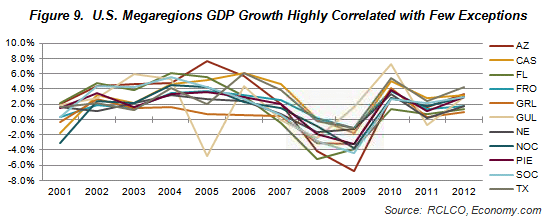
Impact of national factors The effects of external factors on local economies cannot be underestimated. While the U.S. megaregions have different underlying demographic and economic structures, all are influ- enced by U.S. government policies and capital markets. From an individual investment perspective, the different growth, diversification, and infrastructure dynamics of the regions can create significant differences in investment performance. On a larger portfolio basis, though, performance is also linked to national trends. Thus, the economic growth of all of the megaregions is highly correlated (Figure 9). While some regions experience higher growth and some are occasionally affected by local events such as Hurricane Katrina that impacted the Gulf Coast in 2005, the changes in GDP move in a similar pattern over time. (One exception in the past decade was the Great Lakes megaregion, which underperformed from 2003 through 2007.) This should be considered in portfolio construction and is one justification for investing in multiple countries—but that is the topic of another paper.
The U.S. Megaregions
While it is tempting to lump the U.S. megaregions together in a single category, they are actually quite different in terms of both structure and growth patterns. The western regions from the Front Range through California to Cascadia form a large technology-based economy with rural fringes rich in agriculture. Federal, state, and local governments also play a key role in this region. While the lower-cost areas of this region are growing quickly, the high-cost California markets are growing slowly. Southern California is also a bit of an anomaly in the region as it serves as the headquarters of the entertainment industry, encompassing a broad swath of industries beyond the arts—from technology through professional services. Northern California is one of the wealthiest regions in the country, but also one of the most expensive.
The Arizona Sun Corridor has an entirely different profile. While it is another high-growth region, it has a highly diverse economy that often serves as a low-cost, back-office market—particularly for the financial services sector. It has one of the lowest college-attainment ratios of all the regions, and many in-migrants are retired. In fact, Arizona has the lowest proportion of working to non-working persons of all the megaregions, even lower than Florida which has some of the same characteristics as the Arizona Sun Corridor—a large retiree population, high growth, a similar housing market, relatively lower educational attainment and incomes than other regions, but also lower costs of living and a warm climate. However, the Florida economy is slightly different than Arizona, with less exposure to energy and utility companies and more exposure to tourism and retail trade.
The Texas Triangle and Gulf Coast regions are highly dependent on the energy industry, and housing in both regions has held up much better than in the nation as a whole. In fact, home prices in Texas are at all-time highs. However, the similarities stop there. The Texas Triangle is a higher growth market with positive in-migration and a more diverse economy that builds on a much higher base of college graduates, including more exposure to manufacturing and wholesale trade, technology, financial services, education, and professional services.
Piedmont Atlantic, which spans from Memphis and Nashville through Birmingham and Atlanta to North Caro- lina, is another high-growth region. It has a diverse employment base with exposure to professional services and state governments, but most importantly some of the largest airports in the country and firms that specialize in moving goods by air, road, and water both within the U.S. and outside the U.S.
U.S. growth generally slows moving north. The Midwest encompasses a diverse range of metropolitan areas in terms of size, economic base, and growth patterns. One could even argue whether this should be consid- ered as a single megaregion. Farming is important in the northern and western parts of this region from Minnesota to Iowa and Missouri through Indiana and Kentucky. Conversely, the eastern range has fewer farms, particularly in New York, but ranging through Ohio and to a lesser extent in Illinois. The auto industry plays an important role in this region, as do unions, which puts it at somewhat of a disadvantage in attracting new manufacturing industries when compared with some relatively nearby southern states. Educational attainment varies significantly within the region, with several smaller college towns as well as some larger areas such as Minneapolis having highly educated work forces. Economic growth also varies significantly, with struggles in markets such as Cleveland and Detroit offset by more moderate growth markets such as Indianapolis, Louisville, Milwaukee, and Minneapolis.
The Northeast megaregion, which spans from south of Washington, D.C., through New York and Boston, is a large, wealthy, and highly educated part of the country. It is home to the nation’s capital as well as some of the world’s largest financial institutions and significant university and health care systems. This region accounts for 18% of the U.S. job base, with many large metropolitan areas within a few hours drive of each other. While it is a slow-growth area prone to high costs and out-migration, it does include some higher growth areas such as Washington, D.C., and it has been able to maintain a fairly high ratio of working to non-working population.
A High-Growth Megaregion: The Texas Triangle
The Texas Triangle consists of four principal metropolitan areas in Texas: Austin-Round Rock-San Marcos, Dallas-Fort Worth-Arlington, Houston-Sugar Land-Baytown, and San Antonio-New Braunfels. These four metropolitan areas are linked by I-10, I-35, and I-45. The area encompasses 60,000 square miles—comparable to the size of Georgia. It contains 5% of all American households, and 6% of total national economic output. Over $1 trillion of trade flows along the western side of the Triangle along I-35, with trade flows increasing dramatically after the passage of the North American Free Trade Agreement. The Texas Triangle is entirely in one state, offering the region a huge competitive advantage by making investment and policy coordination much simpler.
The Triangle includes three of the nation’s 10 largest cities (Houston, Dallas, and San Antonio), and is respon- sible for most of Texas’s economic activity and output. It currently includes 64% of all Texas households, and is projected to increase to 70% by 2050. By 2025, the area is expected to experience household growth of close to 50%, after increasing by 58% from 1990 to 2010. More than two-thirds of all employment in the State of Texas is contained in the Triangle.
Each metropolitan area in the Texas Triangle contains a strong economy with multiple export industries, defined as those with a location quotient greater than one. Austin is the high-tech and state government center of Texas, with companies such as Dell, Samsung, IBM, and AMD all having major presences in the area. In terms of household growth, it is the fastest-growing area in the Texas Triangle, with 3.5% annual growth from 1990 to 2010—three times faster than the U.S. as a whole.
Dallas is the financial and professional center of Texas, with several corporate headquarters located throughout the Metroplex, including American Airlines, Frito-Lay, JC Penney, and DrPepper Snapple. Banking also plays a significant role in the local economy, with JPMorgan Chase as one of the largest employers in Dallas. Houston is considered the energy capital of not only Texas, but the world. Every major integrated oil firm in the world has a presence in Houston, and the recent growth in natural gas exploration and extraction has fueled a boom in Houston’s economy over the last several years. Although energy is integral to Houston’s success, health care also plays a significant role, with the Texas Medical Center serving as the largest medical complex in the world. Houston also remains a major trade hub, and the Panama Canal widening should provide yet another boost to Houston’s already dynamic economy.
San Antonio is the tourism center of the Texas Triangle, with more than 25 million visitors flocking to the city during the last year. The area also boasts some significant corporate headquarters, including H-E-B and USAA. San Antonio is also home to several thousand members of the U.S. Military, with six bases located in the area.
What is driving growth in the Texas Triangle? The Texas Triangle continues to capture an increasing share of U.S. household growth. From 1990 to 2000, the megaregion captured 7% of national household growth. From 2000 to 2010, it captured over 10% of the nation’s growth in households.
One of the major growth drivers is the low cost of living, which attracts households of all income levels to Texas. Cost of living is about 6.2% lower than the U.S. average, and almost 50% lower than many coastal cities, including San Francisco, Los Angeles, and New York. Housing is a major driver for the low cost of living—housing in the Texas Triangle is 17% less expensive, on average, than the United States as a whole. Much of Texas avoided the major housing bust, with an average peak to trough price drop of just under 3%, compared to 28% for the United States.
Perhaps the biggest driver of the Texas Triangle’s growth is sustained employment growth. All four of the Texas Triangle’s metropolitan areas have exited the recession, with the Texas Triangle reaching pre-recession employment highs in November of 2011. Employment growth in the megaregion has been strong over the last two decades, averaging over 2% per year, compared to just under 1% for the United States.
Finally, energy extraction, particularly natural gas fracking, has played a significant role in the Texas Triangle’s growth. Massive deposits, such as the Barnett Shale in Fort Worth and the Eagle Ford Shale near San Antonio, are leading to significant household and income growth in these areas. Dallas and Houston should continue to benefit, as many of the white-collar energy jobs locate in these cities. This activity has also pro- duced massive benefits for the Texas state government, as sales tax revenue from sales of drilling equipment continue to provide infusions to the state budget.
1 www.america2050.org
2 Economy.com
3 As indicated in the NCREIF database as of fourth quarter 2012.
4 America 2050 New Strategies for Regional Economic Development
5 United Nations, “State of the World Cities 2012-13”
6 United Nations, “State of the World Cities 2012-13”
Disclaimer: Reasonable efforts have been made to ensure that the data contained in this Advisory reflect accurate and timely information, and the data is believed to be reliable and comprehensive. The Advisory is based on estimates, assumptions, and other information developed by RCLCO from its independent research effort and general knowledge of the industry. This Advisory contains opinions that represent our view of reasonable expectations at this particular time, but our opinions are not offered as predictions or assurances that particular events will occur.
Related Articles


Speak to One of Our Real Estate Advisors Today
We take a strategic, data-driven approach to solving your real estate problems.
Contact Us