Interest Rates and Real Estate Pricing Risk
A SIGNIFICANT RISE IN TREASURY YIELDS
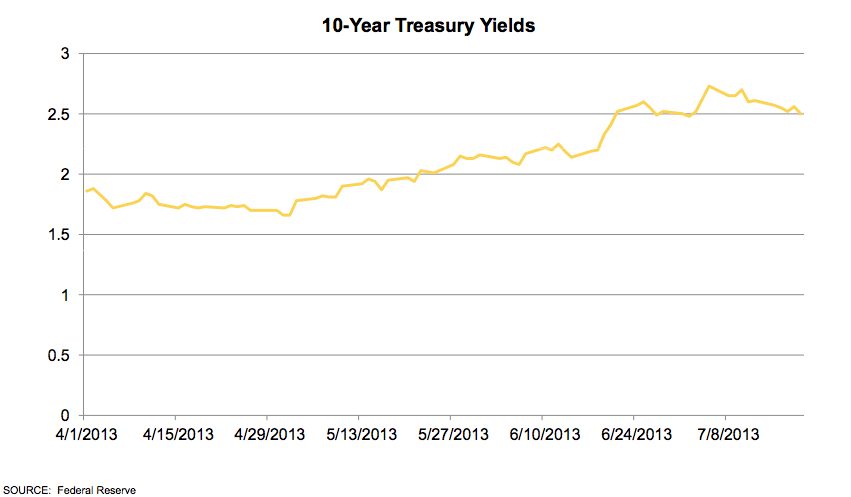
The 100 bp rise in 10-yr treasury yields in May and June caused some temporary disruptions in the lending markets and raised questions of whether this could cause an increase in borrowing costs and cap rates.
THE BOTTOM OF A BOND CYCLE?
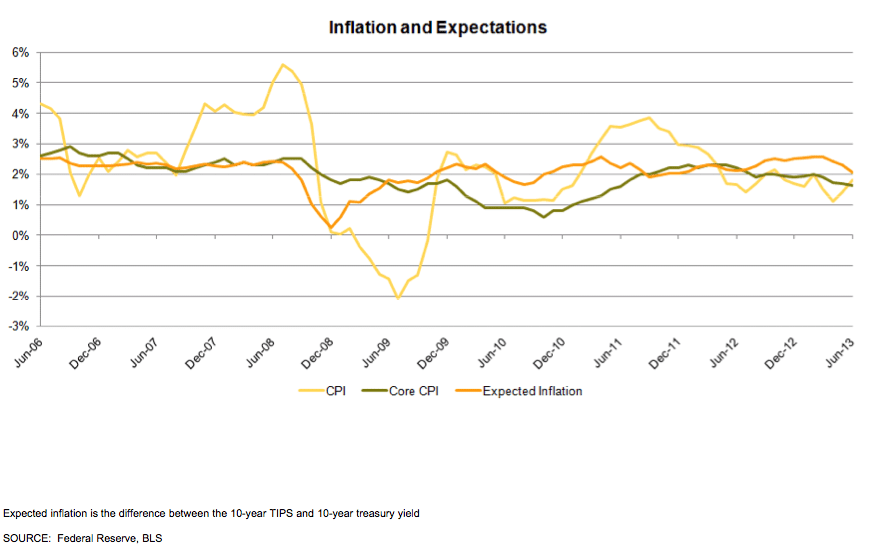
Negative to flat long-term U.S. real interest rates linger as a result of quantitative easing following the recent capital market and economic downturn. These rates are not sustainable.
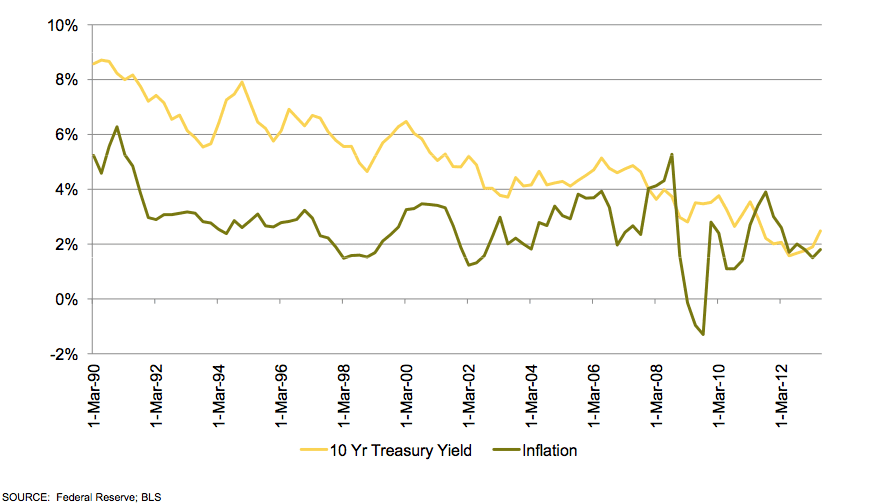
Real treasury yields vary. While real treasury rates have varied significantly in the past, we assume a stabilized real treasury yield of 1.5% to 2.5% which is slightly lower than the 1990s rate. Real rates have been skewed in the past decade—starting with an inverted yield curve (long-term yields lower than short-term yields) in the mid 2000s and then low real rates remaining after 2008 as a result of quantitative easing and distortion from the capital markets downturn. A 1.5%- 2.5% real yield (3.5%-4.5% nominal yield) is also consistent with forward rates on 10-year Treasuries as of July 2013.
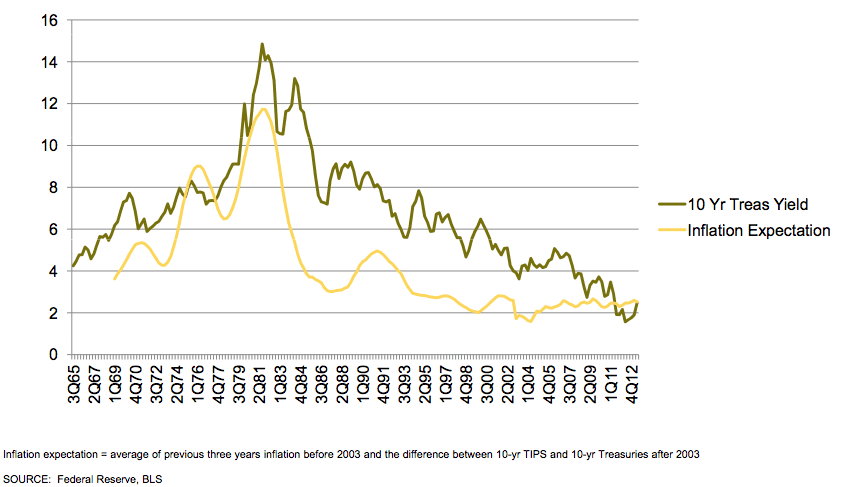
Thus, inflation expectations of around 2% indicate that 10-year treasury yields should at some point rise to 3.5% to 4.5%.
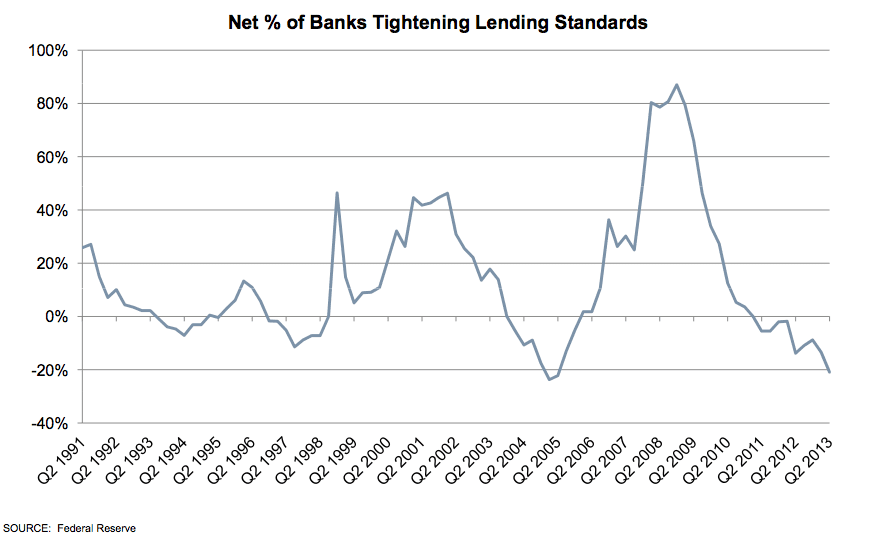
If interest rates rise, could mortgage rates rise as well? The good news is that lenders continued to loosen standards for commercial mortgages through April 2013 in line with improving real estate conditions.
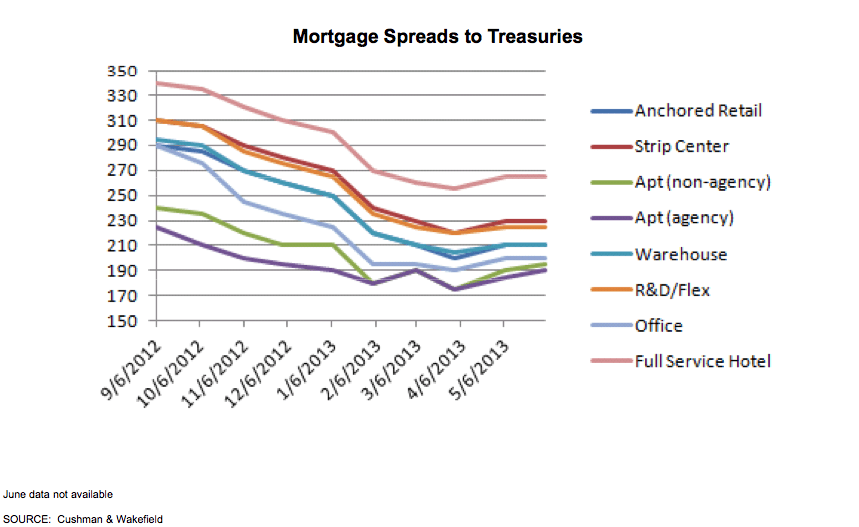
However, borrowing costs became uncertain in the private markets in June and some borrowers postponed closings. Mortgage spreads to treasuries are near average levels and only about 20 bp higher than the average from 1991 to 2007.
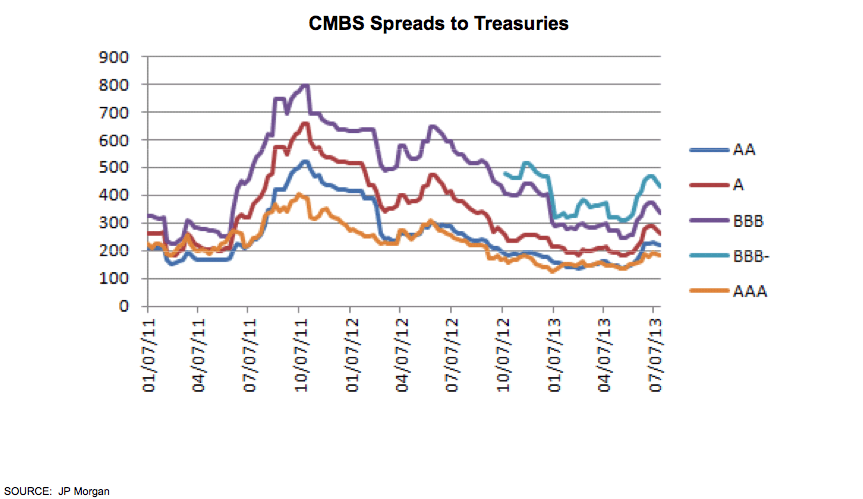
The public markets indicate some relief from higher costs as CMBS spreads rose by 55 bp for AAA to 158 bp for BBB from early May to early June, although pricing has since declined by about 20-40 bp.
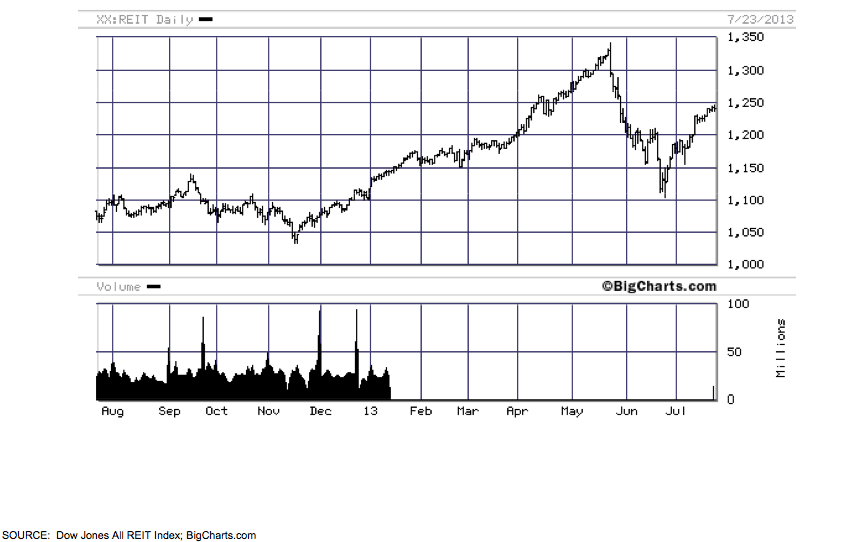
The REIT market has also stabilized somewhat from the downward trend in May and June.
•À_•À_•À_•À_•À_•À_•À_•À_•À_•À_•À_WHAT DOES THIS MEAN FOR COMMERCIAL REAL ESTATE INVESTMENTS?
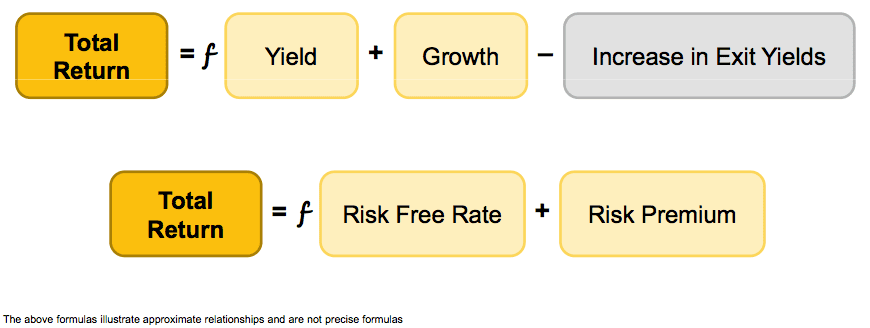
Total returns are a function of going in yields and cash flow growth during the holding period, and are reduced by the increase in exit yields. Holding the total return expectation constant, lower yields can exist if expected growth is higher. And vice-versa, if expected cash flow growth going forward is low, yields need to be higher to maintain the same expected return. Total return expectations can also change, and can be viewed as a premium over risk free rates (e.g. the 10-year treasury). Thus higher treasury rates could also cause total return expectations to rise, putting downward pressure on real estate prices.
We think there is room for treasuries to rise somewhat without putting significant downward pressure on real estate values as real estate yields are currently at significant spreads to treasuries and the real estate market continues to be in a recovery mode with significant expected growth.
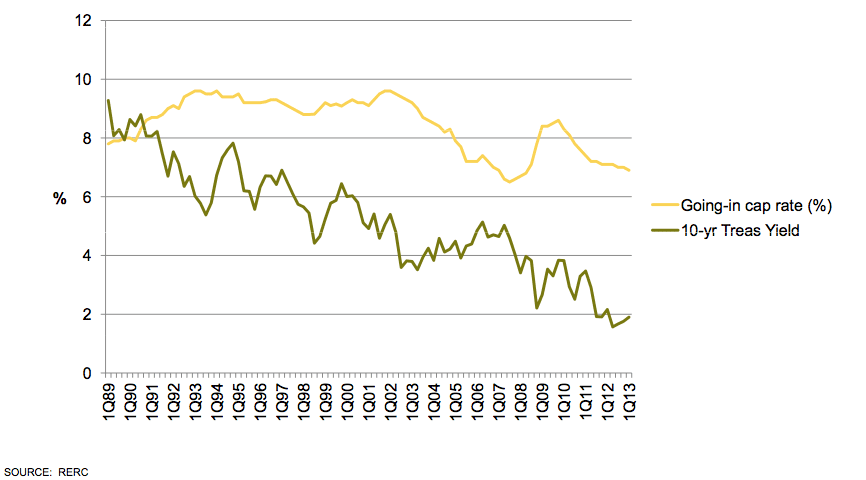
GOING IN YIELDS ARE AT A WIDE SPREAD TO TREASURIES
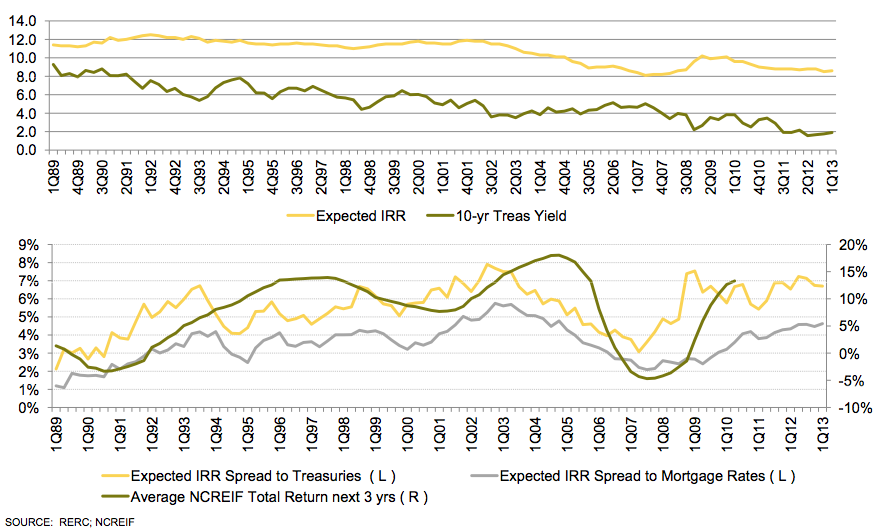
Cap rates did not fall as much as 10-year Treasuries. The resulting spread of over 450 bp is significantly higher than an average of around 250-300 bp and leaves some room for interest rates to rise without significantly impacting real estate cap rates.
There is a wide variance in pricing by property type which primarily reflects occupancy trends. While apartment cap rates have surpassed levels of the previous peak in pricing and CBD office cap rates are back to peak levels, pricing for suburban office in particular is lagging.
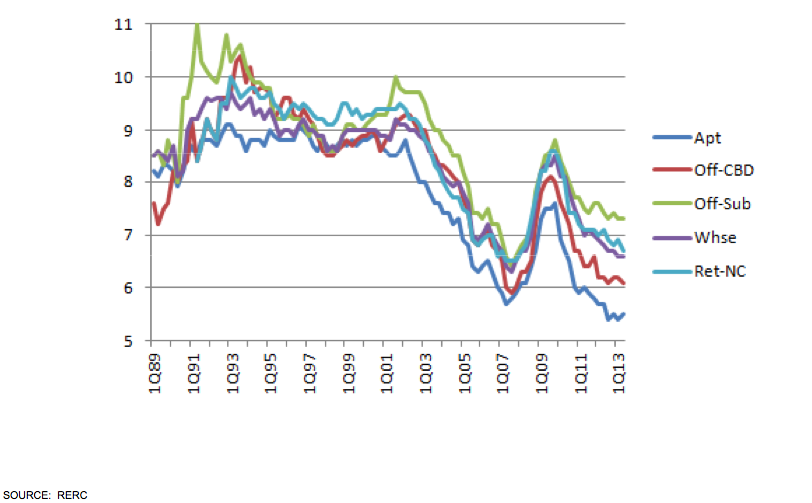
Because apartments have been a popular investment over the past several years, there is also a relatively low spread between apartment cap rates and mortgage interest rates.
Similar to cap rates, total return expectations have not fallen to aggressive pricing levels. Historically, wide spreads between total return expectations and treasuries at the time of underwriting have been followed by above average actual total returns in the next three years.
GENERAL RULES FOR EXIT CAP RATES
- Stabilized exit cap rates should be higher than entry cap rates to account for pricing (term) risk. The market generally builds in a 50 bp increase in exit caps (RERC 1989-2013), although this has been running closer to 60 bp since 2011.
- Other estimation checks for stabilized exit cap rates:
- Forward rates on 10-year Treasuries + a premium
- Historical average rates in similar interest rate environments
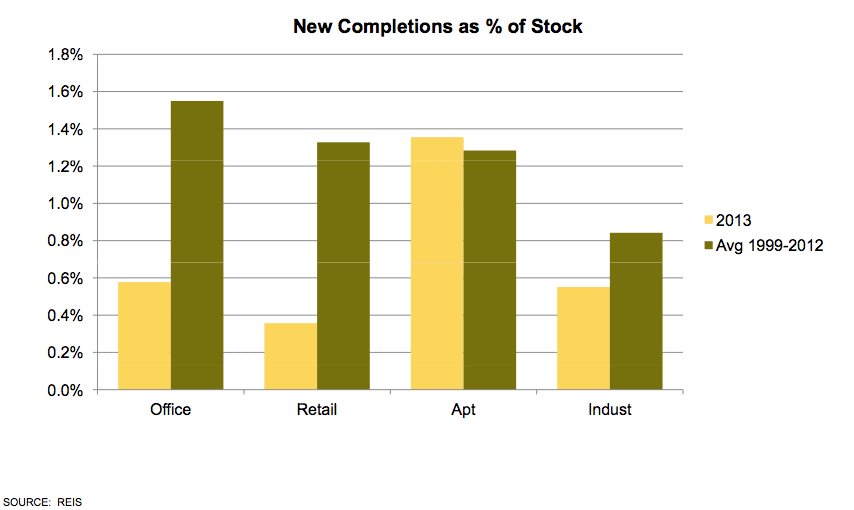
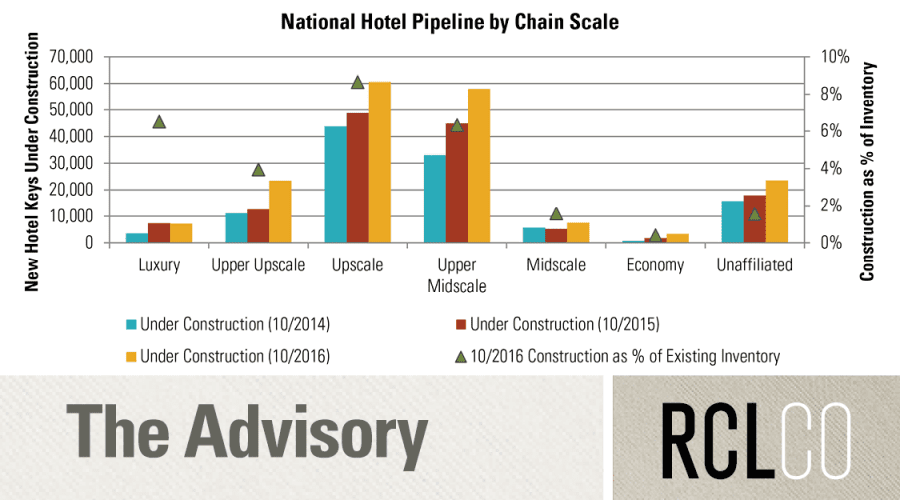
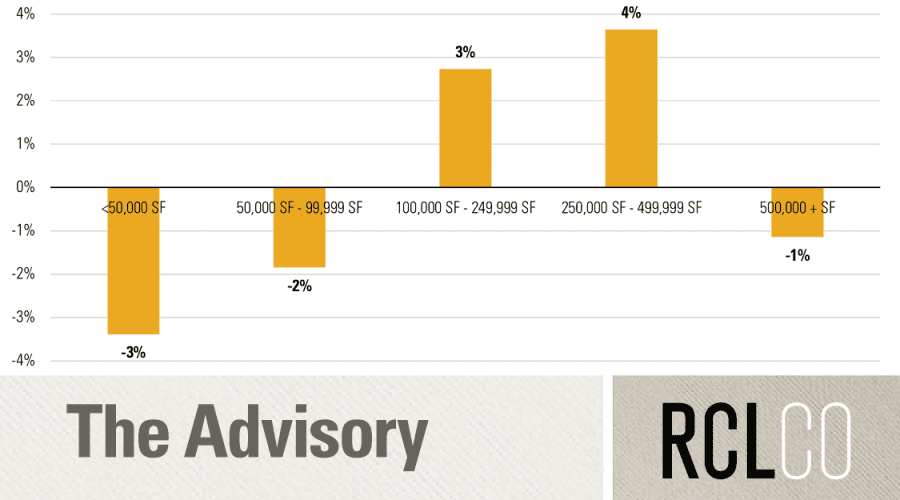
CONSTRUCTION SUBDUED
Construction pipelines are growing but remain relatively subdued in most markets. One exception is the apartment sector.
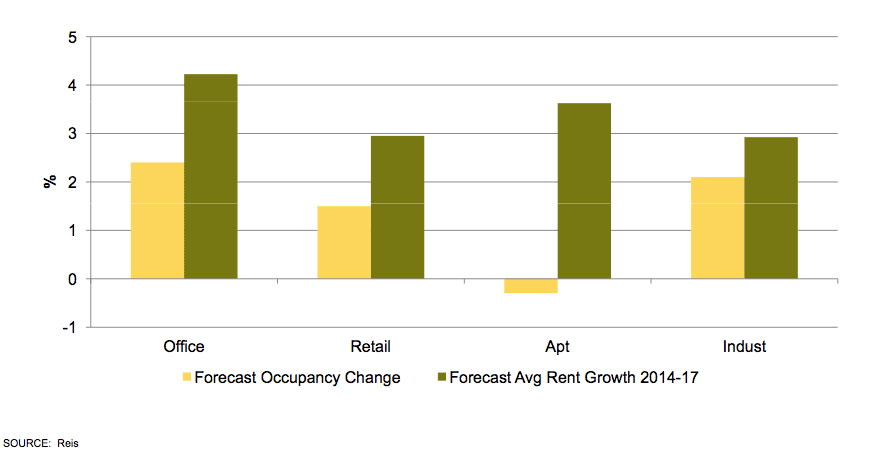
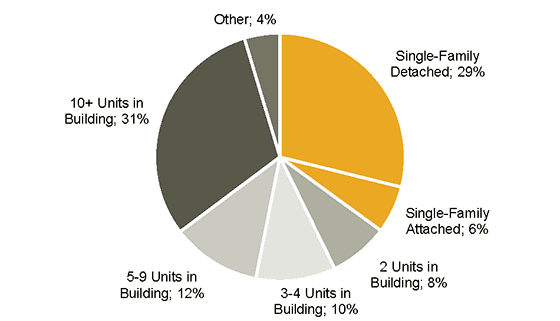
PROPERTY GROWTH EXPECTATIONS POSITIVE
U.S. commercial properties continue to recover from the downturn with upside expected in both rents and occupancy. Even though apartment occupancy is not expected to improve because of the construction volume, high occupancy rates are expected to generate positive rent growth. Our expectations are that apartment rental growth could be closer to inflationary levels (2%) and lower than the below REIS forecast as new projects continue to be delivered in the near term. Growth will also vary significantly by metro area for all property types.
U.S. REAL ESTATE CYCLE
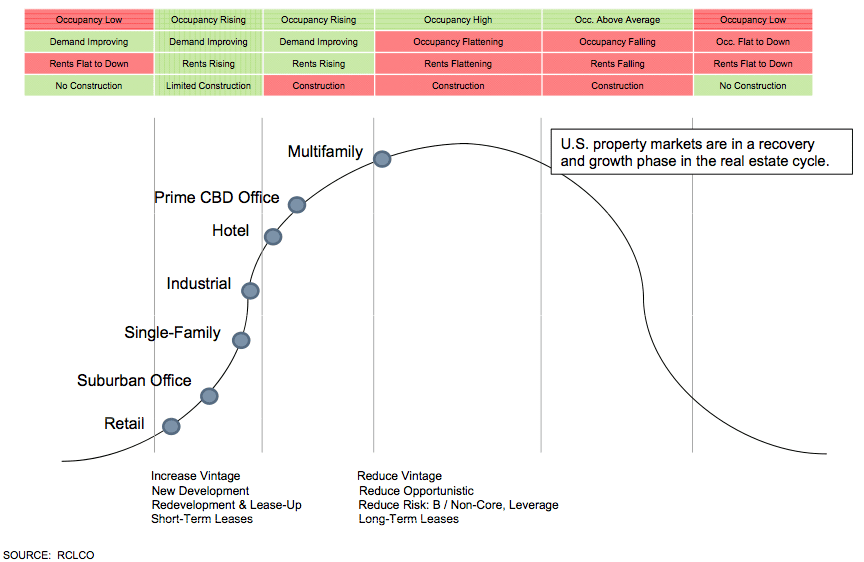
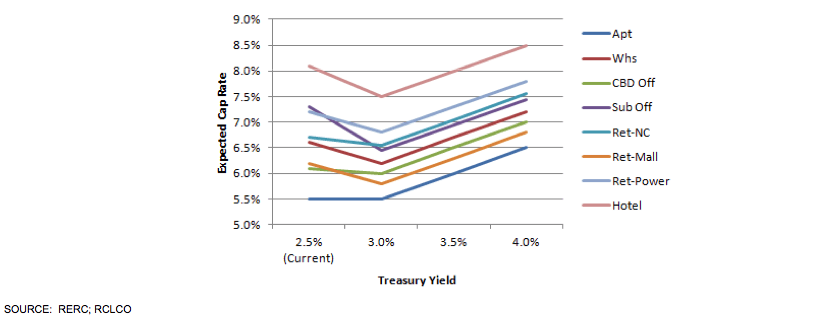
INTEREST RATE RISK HIGHER FOR APARTMENT AND PRIME CBD OFFICE
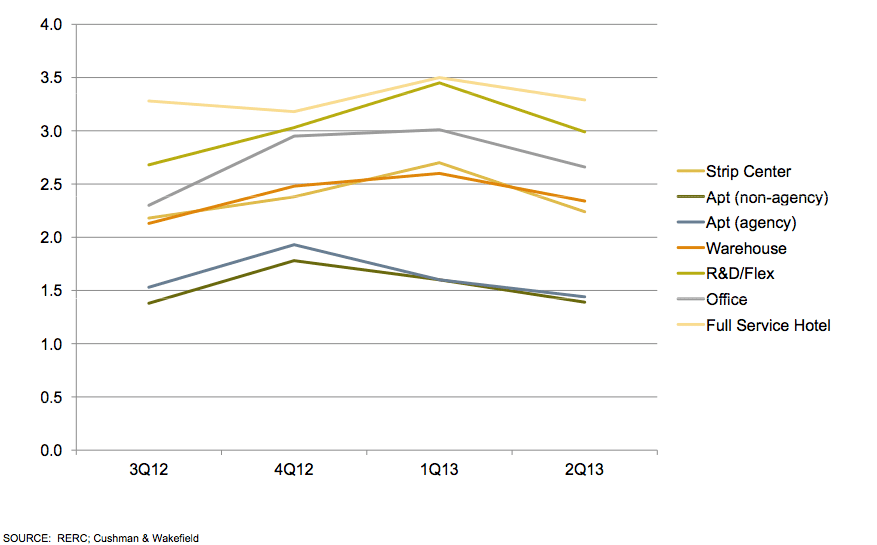
The graph below shows current average cap rates by property type (with 10-year treasuries assumed to be near 2.5%). To estimate what could happen if interest rates rise, a long-term average spread for each property type is added to the 10-year treasury rate. The long-term average spread is lower than the current spread for all property types. While no cap rates rise significantly at a 3.0% treasury yield, apartment and CBD office are currently priced near long-term average spreads and thus are most at risk to experience larger increases in cap rates if interest rates rise. However, keep in mind that this is just an average spread. Spreads could drop to below average levels, particularly for apartment and prime CBD if the market becomes risk adverse again or particularly for prime CBD office, if the U.S. is viewed more favorably relative to other countries, driving investment dollars into prime CBD locations. Conversely, hotels, suburban office, and industrial properties have a significant spread cushion that could somewhat shield them from interest rate increases. In this analysis, 3.5% treasury rates (a 100 bp increase) imply an approximate 50 bp cap rate rise for apartments and prime CBD office with minimal impact on other property types.
HIGHER LEVERAGE AND SHORTER HOLD PERIODS AMPLIFY INTEREST RATE RISK
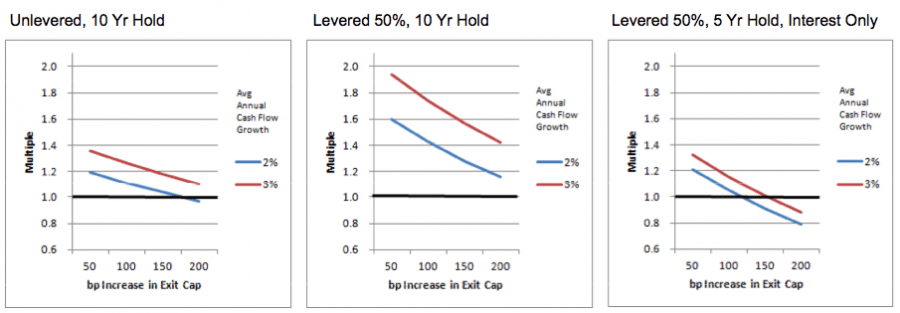
WHAT HAPPENS IF TREASURY YIELDS RISE TO 3.5% OR MORE?
- Property types most at risk:
- Apartments
- Things that amplify interest rate risk:
- Low or unstable cash flow growth
- High leverage
- Low debt coverage ratios
- Short hold periods
- Need for near-term refinancing
SUMMARY
- 10-yr treasury rates rose by more than 100 bp to near 2.7% in early July. Stabilized real treasury yields are more likely to be in the 3.5%-4.5% range (another 100-200 bp higher). Most recently, the 10-yr yield treasury yield fell by about 20 bp in the past two weeks, and the public real estate markets (CMBS and REITs) have both reversed somewhat from weakening trends in May and June.
- Cap rates could rise in response, but are likely to increase by a lesser amount than treasuries because:
- Cap rates are currently at unusually wide spreads to treasuries providing some cushion
- Property markets are generally in recovery mode with positive occupancy gains and positive real rental growth
- Some exceptions:
- Apartments are well into a construction cycle and are fully priced. High occupancy rates should continue to generate positive rental growth, although this is likely to revert to levels closer to inflation (2%) as the construction cycle matures. Prime CBD office is also fully priced. However, significant variances exist by metro area.
- A further 100 bp increase in treasury yields to the 3.5%+ range could create an approximate 50 bp increase in cap rates, particularly for some apartment and prime CBD office properties that are near peak pricing, with lesser impact on other markets and product types that are currently pricing at wider spreads. Thus, while markets are pricing in a 60 bp increase in exit cap rates, up to 100 bp could be more appropriate for some apartment and prime CBD office projects.
- Watch list: investments with low growth or unstable cash flows, high leverage, low debt coverage ratios, short hold periods, variable rate financing, and near-term financing needs.
- Action items:
- Mortgage spreads to treasuries are near long-term averages. Watch forward treasury curves and bank lending standards for expected changes. Price long-term vs. short-term financing and lock in rates where feasible.
- Build in mortgage rate increases of up to 200 bp in scenario analyses for refinancing needs (with the higher end of this range more likely the further out in time).
- Identify interest rate risk in allocation and risk planning, including evaluation of effect of mix of short-term and long- term leases, given that short-term leases are riskier but potentially permit rent increases in a higher interest rate and inflation rate environment.
For more information, please contact Paige Mueller at pmueller@rclco.com or at (310) 601-4919.
Related Articles


Speak to One of Our Real Estate Advisors Today
We take a strategic, data-driven approach to solving your real estate problems.
Contact Us