Millennial Urban Preferences: Will They Last?
Generation Y, or the Millennials, and their consumer preferences are a dominant presence in the news headlines these days, and with good reason. This demographic cohort, defined as those born between 1980 and 2000, recently surpassed the Baby Boomers as the nation’s largest living generation.1 In such a large generation, any change in preferences will have an outsized impact on the country. The Millennials are particularly relevant to residential real estate as they represent the largest source of new demand for rental and for-sale housing moving forward.
Much has been made of the recent urban renaissance across the country and the pivotal role of the Millennials in fueling this transformation. But is this trend toward denser, more urban living due to a fundamental shift in residential preferences or a product of delayed life stages?
Through an examination of changing residential locations among 22-34 year old households in the country’s 10 largest metropolitan areas, it becomes clear that the recent resurgence in urban living is driven by a younger, childless demographic while older, child-present Millennial households demonstrate propensities for urban living that are largely unchanged over the past 10 years.2 If the Millennials eventually form child-present households at pre-recession levels, they will likely suburbanize at much the same rate as the previous generation.
Increasing Urban Propensity
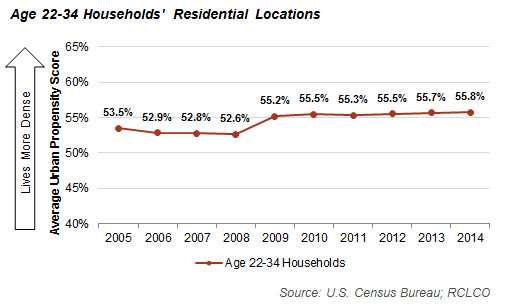
Over the past 10 years, 22-34 year old households have demonstrated increasing propensities for denser, more urban living. The Great Recession functioned as a disruptive shock altering the previous downward trend toward less dense residential locations. Following 2008, this age cohort began increasingly clustering in the densest quartile of locations, largely at the expense of the lowest density quartile that was typically most affected by the housing bubble burst. These trends toward denser living environments have continued their upward trajectory in recent years, though at a more gradual pace.
Accelerating Overall Urban Propensities
Average Urban Propensity Score: the percentile that the average household lives in within a particular region, ranked by population density. A higher urban propensity score implies that the household type is on average living in the more dense areas of their region. See the end of article for a detailed explanation of Urban Propensity Score methodology.
Household Characteristics Fueling Trend
While there is an undeniable trend toward more urban living among the Millennial generation post-recession, this propensity is not evenly distributed among all demographic segments.
Nonfamily Millennial households are clustering in their region’s more dense communities at greater rates than their counterparts of years past were. Childless married households also exhibit increasing urban propensities, reversing a pre-recession trend toward more suburban communities. However, households with children are not following this same trend and instead choose residential locations with similar relative density levels as those in the pre-recession years.
Household Type
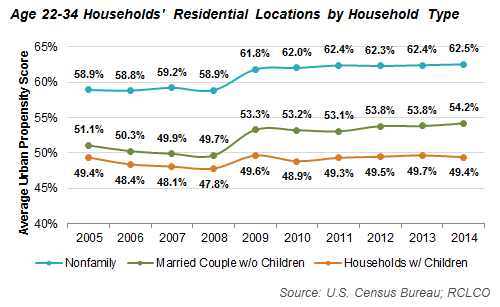
Shifting household type characteristics account for an important dimension of the recent urban renaissance, as the share of 22-34 year old households with children has fallen from approximately 48% to 44% from 2007 to 2014. After three decades of stable fertility rates among women in their 20s, birth rates declined by 15% between 2007 and 2012, coinciding with rising economic uncertainty.3 While it remains to be seen whether these childless households will exhibit higher rates of childbearing in their later years, a shift toward historical fertility levels and a corresponding rise in child-present households would likely bring the age cohort’s residential tendencies closer to pre-recession levels.
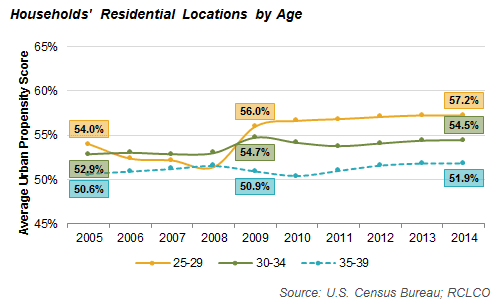
Age of Householder
Perhaps the best evidence that urbanizing Millennial residential locations are at least partially a product of delayed later life stages is the discrepancy in trends by age group. Accelerating propensities for denser living environments are most pronounced among 25-29 year old households, while the pace of change is more muted among the 30-34 age cohort.
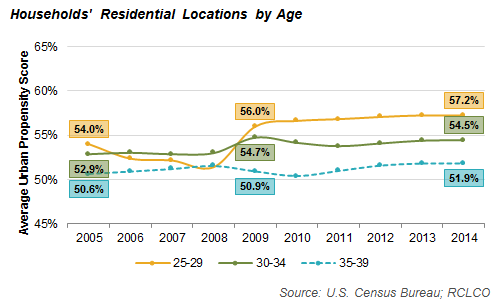
Delayed family formation most dramatically impacts the age 25-29 demographic where the proportion of households with children fell by 7.5 percentage points, from 42.5% to 35%, in the past nine years. While it is possible that households aged 25-29 will continue their urban propensities through parenthood, the fact that residential locations of households with children are relatively consistent across each sub-age group and remain largely unchanged over the past 10 years casts doubt on this possibility.
Can We Expect These Trends to Continue?
Though household activity in the top 10 metropolitan regions cannot necessarily be generalized nationally, a critical examination of census data points toward increasing propensities for suburban living as the generation ages and has children. Younger households unencumbered by children are fueling much of the growth in dense, urban neighborhoods, while older, child-present households have not displayed a similar uptick in urban propensity. Though difficult to predict future demographic trends in the aftermath of the Great Recession, a reversion toward pre-recession household characteristics among the Millennials would likely yield residential location decisions similar to the previous generation.
Methodology
RCLCO analyzed 1-Year Public Use Microdata Samples (PUMS) from 2005 through 2014 to ascertain changes in residential propensities among 22-34 year old headed households. Population densities of Public Use Microdata Areas (PUMA) were used as the basis of the analysis with higher density conditions considered to reflect a more urban environment, and vice versa. Though less precise than census-tracts, this geographical level of analysis enables the exploration of untabulated census data allowing for a more detailed investigation of household characteristics and preferences.
For each household type, an average urban propensity score was calculated by finding the density percentile of the average household’s PUMA location with respect to the distribution of PUMA density levels in each metropolitan region.4 For example, a 55% urban propensity score for married couple households indicates that the average such household lives in a PUMA that is denser than 55% of other PUMAs in the metropolitan region. A higher propensity score therefore implies that the household type is on average living in the more urban areas of their region.
1 U.S. Census Bureau. There is no strong consensus over the exact definition of this generation, though demographic sources generally place the boundaries somewhere between the late 1970s and the mid-2000s.
2 Includes the New York, Los Angeles, Chicago, Washington, D.C., San Francisco, Boston, Dallas, Philadelphia, Houston, and Miami Combined Statistical Areas (CSA) as defined by the U.S. Census Bureau.
3 Urban Institute. (2015, April). Millennial Childbearing and the Recession. Retrieved March 13, 2016.
4 PUMA geographies changed between 2011 and 2012 and above propensities are adjusted to account for shifting total population counts by PUMAs.
Disclaimer: Reasonable efforts have been made to ensure that the data contained in this Advisory reflect accurate and timely information, and the data is believed to be reliable and comprehensive. The Advisory is based on estimates, assumptions, and other information developed by RCLCO from its independent research effort and general knowledge of the industry. This Advisory contains opinions that represent our view of reasonable expectations at this particular time, but our opinions are not offered as predictions or assurances that particular events will occur.
Related Articles
Speak to One of Our Real Estate Advisors Today
We take a strategic, data-driven approach to solving your real estate problems.
Contact Us