Strategy for Real Estate Companies: How to Manage for the Cycle – Part 1
Part 1 of 2: Real Estate Market Cycles – Making the Call
Now that the economy and real estate markets seem to be on somewhat firmer ground, it’s time to start thinking about the next downturn. What? Too soon?
Not at all—it’s never too soon to start thinking about how to position your real estate company not just to survive, but to thrive, in all phases of the cycle. And there is no better time to act than when things are going well. Truly strategically oriented real estate companies have both processes to monitor their markets, and a set of actions or “cycle strategies” thought through in advance to help them identify and navigate changing market conditions.
 It’s like having one of those enormous laminated sheets that all those NFL coaches always seem to be carrying around. As the coach of your real estate enterprise, you need to have a series of plays spelled out before the game that you can call upon in the right situation. There are probably 200 plays on that sheet, but fewer than a third ever get called during an NFL game—but you can bet the coach and his staff (sorry, I am pretty sure all NFL coaches are men) have figured out at least one play for any given situation.
So too should the leadership team of every real estate organization have a play sheet. And sure, why not, get it laminated—you never know.
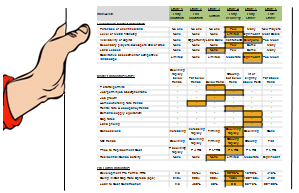 Here is the play sheet that we would put in Bill Belichick’s hand if he were coaching our real estate company team—more on this later.
So if the Great Recession did not remind everyone in this business, write it down: real estate is one of the most cyclical industries in the economy—it experiences higher highs and lower lows than nearly every other industry, including automobiles, aerospace, energy, etc. Relatively small changes in the overall economy can cause huge swings in real estate, particularly if there is a rapid erosion of consumer confidence or a change in capital market liquidity. The old saying goes, “when the economy catches a cold, the real estate industry contracts pneumonia.” Well, the last time around, real estate was actually the source of the contagion! The result was even more pronounced.
More than any other factor, the reaction of industry players to the real estate cycle determines what the strategy of a real estate company should be. When formulating a strategy, a company therefore must start with an understanding of the effects of these cycles. To ignore the extreme cyclical nature of the industry is to place a company in peril, dooming it to continuous crisis during every real estate downturn. If companies do not plan adequately for downturns, they will never survive to enjoy the inevitable upturns.
 Okay. Now that you have rediscovered religion on this topic, the next question is: when? When will your real estate market(s) reach the next cyclical peak and turn from expansion to contraction? Trick question—that is totally irrelevant! Well, to be fair, it’s pretty relevant—better to say it is really challenging to tell. But that should not stop you from monitoring the situation and formulating a company “point of view.” And it certainly should not prevent you from putting in place cycle strategy actions to deploy to protect the firm’s assets when you do actually “know” that the market has in fact peaked and moved from one stage of the cycle to the next.
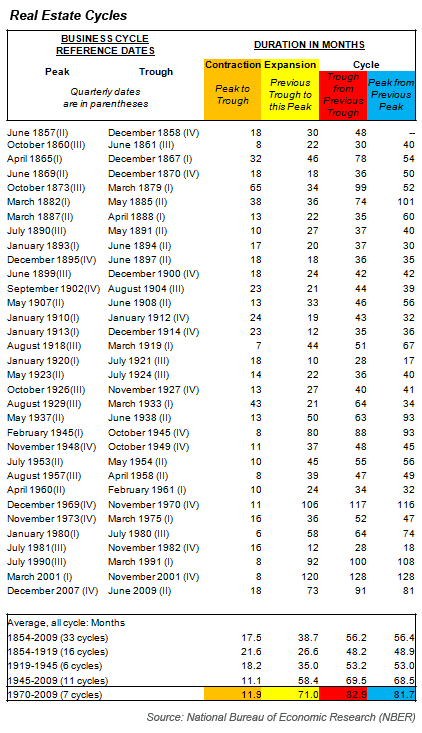
If history is any guide, we know that since World War II there have been 11 cycles (for the purposes of this exercise, we are using NBER data as a proxy for the real estate cycle, but, of course, we know that the real estate cycle and the overall economic cycle don’t always coincide). The average trough-to-peak cycle has been five to six years. Since 1945, the shortest trough-peak expansion was 12 months (the second of the early 1980s double dips); the longest was 120 months (the run-up from the March 1991 trough to the March 2001 peak); and the average has been 58.4 months.
Peak-to-peak during this same time frame has averaged 81.7 months, or just shy of seven years, with the shortest span lasting only 18 months (again that second hump in the 1980-82 double dipper), and the longest 128 months (or nearly 11 years, covering most of the 1990s).
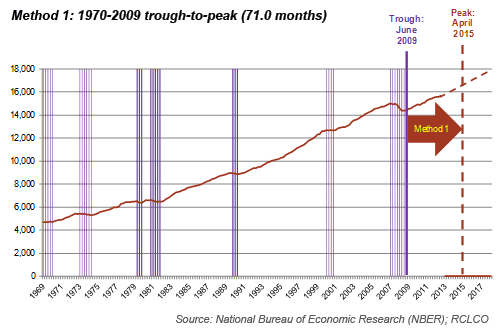
So, if you take the trough-to-peak average since the 1970s of 71 months, and apply this to the most recent trough that the National Bureau of Economic Research (NBER) declares occurred in June 2009, the math would tell you that the next peak will occur in April 2015.
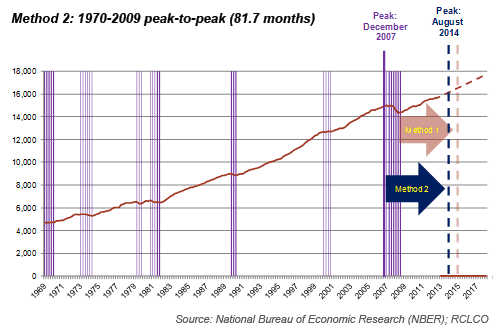
A similar peak-to-peak calculation using the average since 1970 of 81.7 months indicates that the last NBER cyclical peak that occurred in December 2007 will produce the next peak in August 2014. Pretty sure it will fall on a Tuesday?! Still think it’s too soon to begin planning?!
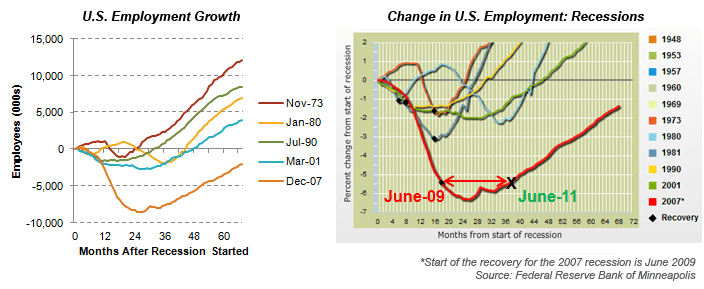
But wait a minute. Let’s not forget that this last peak and trough were part of the Great Recession—a cycle that has been deeper and longer than any downturn since the Great Depression. Why do we call these things “great”? And hold on another minute—June 2009? That’s when NBER called the bottom of the Great Recession? The shape of the most recent downturn, near depression levels, is way more gravy boat than hockey stick, and it is fair to say that, with only a few exceptions, most metropolitan area economies and real estate markets were scraping along the “bottom” for an extended period of time.
If you assume, as I do, that the “recovery” from the Great Recession did not begin in earnest until the markets had experienced at least six months of continuous positive job growth without the perceived fear of slipping back into recession, then the last “trough” was in reality not until sometime in the second quarter of 2011.
Turning back to our math, then, the average trough-to-peak duration from 1970 on would indicate that the next peak is due on or about March 2017. The peak-to-peak average duration has us peaking in February 2018—pretty sure it will fall on a Tuesday. Okay, with the margin of error, it could fall on a Wednesday.

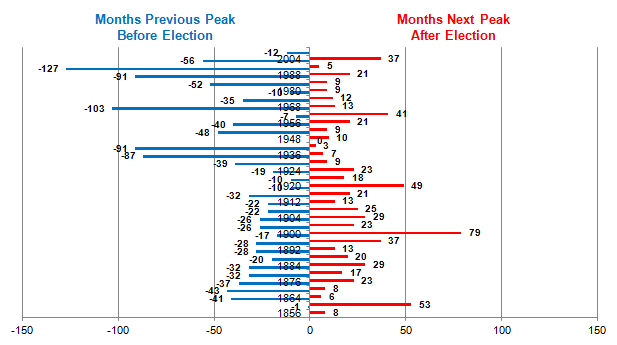 Calling the next cyclical peak after the 2016 election is consistent with the conventional wisdom that the current administration and the Federal Reserve will do everything in its their power to stave off any weakening in the economy until after the 2016 election. Note to self—conventional wisdom is code for “usually wrong” or “no basis in fact.” We looked into it, and there is no correlation between the timing of a presidential election and a peak in the economy—either the length of time leading up to, or following, an election. Pretty random stuff actually.
So now we have narrowed it down—the next peak will most likely occur sometime between August 2014 and February 2018! Thanks for the heads up.
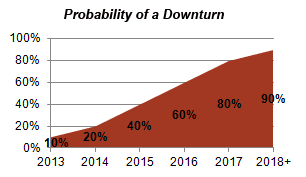 What is perhaps more relevant than trying to determine a particular moment in time is to talk in terms of probabilities. What is the probability that my market(s) will peak and enter a downturn between now and the end of 2014? What’s the probability of a downturn in the 2015 to 2016 timeframe? What’s the probability in 2017+? There is nothing particularly scientific about the probabilities below, but rather our current point of view that we use to monitor our own business.
And let’s admit openly that it is very challenging ahead of time to determine exactly when the next downturn will be, nor how deep, nor how long-lasting it will be. One thing’s for sure, it isn’t likely to be like the last one (let’s hope?!), and won’t equal the average—rarely does. The one thing that you can be certain of is that there will be another downturn.
And, with the probability chart above in mind, you had better think about how you are going to “know” when the next one comes, and what you are going to do differently leading up to the next cycle peak and through the inevitable downturn and then recovery.
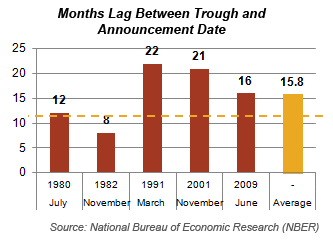
Okay. So how do you “know”? One of the frustrating things is the lag in data to help you know when the market turns from expansion to contraction, or when the bottom of the market is. Very often, the confirming information arrives long after the event has occurred. If you waited for the NBER to tell you when the economy peaked, on average you would be informed nine months after the fact, and you would have to wait 16 months on average for the NBER to tell you when the downturn has ended.
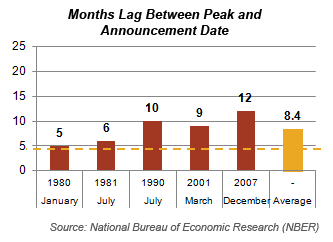
You will, however, get a strong indication in advance of a peak that your market is becoming overheated, and you will know with a high degree of certainty that the market has moved from one phase of the cycle to the next approximately three to six months after it has happened—we don’t have to wait for NBER to tell us, we know. But by then, it may be too late to do anything about it.
What is absolutely essential, particularly as a real estate company enters the late “Stable” phase of the cyclical upturn and approaches a peak, is to analyze and interpret signs that indicate the probability that a peak is imminent, take graduated actions in advance of the peak to mitigate risk and protect the company from bad things happening to it in the downturn, and position the company to take advantage of opportunities that will inevitably be available in the downturn.
Those who wait to prepare and deploy cycle strategies until it is clear that the current growth strategy is no longer applicable have probably waited too long. Being able to anticipate and plan for downturns or other adverse conditions is critical for success in real estate during the next several years. It is well known that vast real estate fortunes are created during relatively brief periods of dislocation and inefficiency—read, in the real estate cycle trough.
What really matters is that you and your company have a plan for dealing with a number of possible outcomes and probabilities. At this point in the economic cycle, everyone involved in real estate should be asking: how well am I prepared in the event that there is a slight hesitation or a mild economic slowdown sometime in the next two to three years? What about a more severe and (by its very nature) unanticipated downturn or, gasp, another deep recession? What economic and real estate market indicators should I be tracking to help me gain perspective on where my market is and where it is heading? What cycle strategies should I have in my hip pocket ready to deploy at the right moment instead of deciding on in the heat of the moment?
Up next, Part 2: Real Estate Market Cycle Stages and Strategies
Disclaimer: Reasonable efforts have been made to ensure that the data contained in this Advisory reflect accurate and timely information, and the data is believed to be reliable and comprehensive. The Advisory is based on estimates, assumptions, and other information developed by RCLCO from its independent research effort and general knowledge of the industry. This Advisory contains opinions that represent our view of reasonable expectations at this particular time, but our opinions are not offered as predictions or assurances that particular events will occur.
Related Articles
Speak to One of Our Real Estate Advisors Today
We take a strategic, data-driven approach to solving your real estate problems.
Contact Us