
Housing Progress Interactive Index

Advisory-Housing-Index-Interactive-Map Feature Image
May 1, 2023 Housing Demand Real Estate Market Trends

Introduction

As housing attainability challenges in the United States have spread beyond the typical “high-cost coastal markets,” continued attention is needed regarding the relationship between slowing new housing supply and the crisis of affordability. Recent research indicates that there is a national production shortfall of 3.79 million housing units, with 169 regions experiencing underproduction as of 2019. Both indicators have worsened since 2012.[1]  While there was a ramp up in supply coming out of Great Financial Crisis of 2008, affordability has been a consistent challenge across many major markets, and activity has not been equal across market sizes, geographies, or types.

While some markets continue to add, and a few even show signs of accelerating new supply, others including some so-called low barrier to entry markets, have stagnated. Of equal concern, density and diversity of new housing supply has only made marginal changes in most markets over the past decade. Growing deliveries of multifamily housing are one bright spot, but the response of the housing industry has been limited compared to changing demand conditions.

Under-production and the continued dominance of the single-family home contribute to slow progress toward the goal of a housing delivery system for the U.S. that meets the consumer needs and economics and raising level of housing budget.  By one critical demand measure — the share of rent-burdened households  — we continue to fall behind. In most major metros, over 50% of renter households are burdened, or pay over 30% of income on rent as of 2021.


The Tool

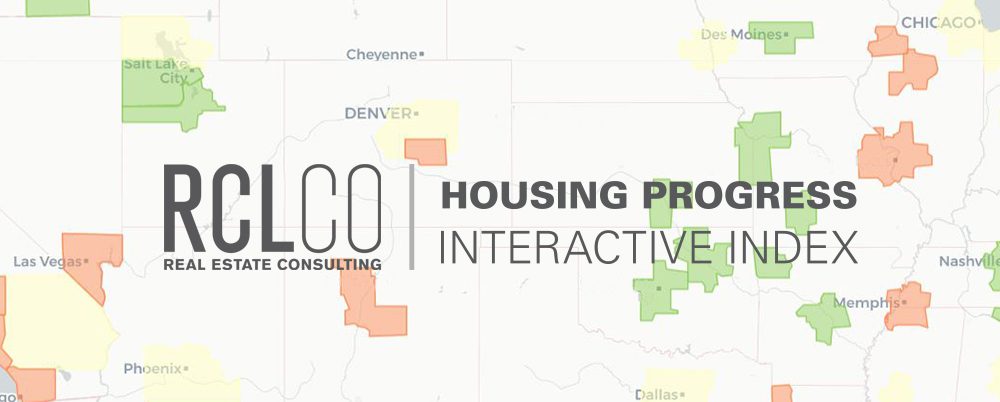
RCLCO and the ULI Terwilliger Center for Housing have collaborated to develop the Housing Progress Index to answer the key question: which U.S. regions have been making the most forward progress relative to three widely shared housing goals that relate to expanding attainability: increase the level of new supply, increase housing diversity, and reduce housing (measured here as rental) cost burdens?

The index emphasizes simplicity, focusing on only these three key metrics:

  1. The average annual percent change in overall housing units (with an increase being a positive score) over the past decade
  2. The average annual percent change in the housing diversity over the past decade (an abundance of different sizes of dwelling units, including duplexes, multifamily units, etc. is a positive score)
  3. The average annual percent change in rent burdened households over the past decade (a decreasing share is a positive score)

The three factors are weighted equally and aggregated into an index that ranks overall progress for the top 150 largest MSAs in the U.S., as a way to help understand where housing production conditions are most improving and where they are getting worse relative to the goal of expanded housing attainability. The interactive tool allows for users to toggle the different metrics for different years, as well as view the overall past decade progress rank for one MSA at a time.

Examples of the Interactive Tool:

Zoom, Pan, and Hover

Navigate the map by zooming, panning and hovering over highlighted areas to get an extensive breakdown of that specific area

Toggle Various Inputs

Select Market, Variable and Year (2012-2021) to change the comprehensive information generated listed to the right and bottom of the map

Unpacking the Progress: 50 Largest Markets

Amongst the 50 largest markets specifically, there are some interesting, and perhaps not surprising, results. In terms of supply increases, mid-sized, fast-growing sunbelt markets are favored, with key markets like Charlotte, Austin, and Raleigh rising to the top. Some of these same sunbelt markets, specifically San Antonio and Raleigh, are also leaders in terms of housing supply diversification. In contrast, many of the bottom performers in terms of supply additions and diversity are rustbelt markets with a large share of dated housing and more stagnant growth, with some more notable markets like Phoenix falling to the bottom of the diversity list, given more affordable and ample land that has continued to drive significant single-family development.

On the demand side, the trends are slightly different. Here, several rustbelt markets have made the most progress; outmigration and less robust growth has allowed for meaningful progress in reducing cost burdens, whereas some major, historically affordable markets like Denver and Houston have struggled the most, seeing strong increases in renter burdens across income levels over the past decade. The aggregate index continues to highlight several mid-sized sunbelt markets; Orlando is the top performer in terms of progress, given its relative strong progress in all three areas, with high-cost coastal markets showing the least signs of progress in recent years.

Housing Increases Chart -Advisory - Housing Index
Source: RCLCO

VIEW INTERACTIVE TOOL


Article and research prepared by Dana Schoewe, Principal

[1] Kingsella, Mike, and Leah MacArthur. “Housing Underproduction in the U.S., 2022.” Up for Growth. Accessed July 18, 2022. https://www.upforgrowth.org/underproduction.

Disclaimer: Reasonable efforts have been made to ensure that the data contained in this Advisory reflect accurate and timely information, and the data is believed to be reliable and comprehensive. The Advisory is based on estimates, assumptions, and other information developed by RCLCO from its independent research effort and general knowledge of the industry. This Advisory contains opinions that represent our view of reasonable expectations at this particular time, but our opinions are not offered as predictions or assurances that particular events will occur.

Speak to One of Our Real Estate Advisors Today

We take a strategic, data-driven approach to solving your real estate problems.

Contact Us

Sign Up For Our Newsletter