Vacation Housing Recovery Tied to Primary Housing Starts
Recovery Soon Is Likely in Areas that Have Been Lagging
By: Taylor Mammen, Principal/Director of Consulting, and CJ Faulwell, Associate
Summary
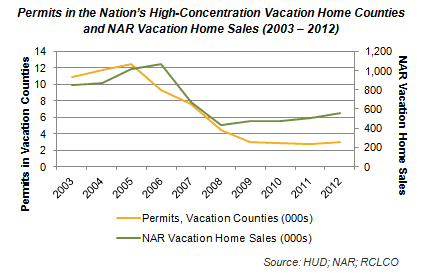
The U.S. vacation home development industry is perceived to be even more cyclical than the overall U.S. homebuilding industry. As the National Association of Realtors (NAR) Investment and Vacation Home Buyers Survey reports, vacation home sales volume plummeted 59% from the peak year of 2006 to the trough in 2008 (from 1,067,000 sales to 436,000 sales). On the other end of the spectrum, many long-time second home developers can recount years in which they couldn’t deliver enough inventory to satisfy demand.
Vacation home industry players both expect and understand this sales volatility, as they know that their product is inherently discretionary: as much as life may be immeasurably better with that condo on the ski mountain or at the beach, nobody actually needs that second home. But still, the vacation home industry would like to have some observable, quantitative indicators to hang its hat on to understand when and how turns in the second home market are likely to occur. While we know that employment growth is inevitably going to lead to office absorption and household growth to primary home construction, we have, to date, no similar macroeconomic indicators of vacation home construction or sales.
RCLCO recently conducted a research project to identify whether any quantitative macroeconomic or demographic factors would indicate vacation home construction recovery, in spite of its discretionary nature. Ample anecdotal observations of communities that we have consulted on over the years provided a range of potential independent variables to test: peaks in the age 45-64 population (the age at which we are most likely to own vacation homes);1 heightened economic and consumer confidence, as indicated by a range of factors; primary home values that can be leveraged (either literally or psychologically) to assist with a vacation home purchase; etc.
After first identifying a way to measure vacation home construction over time (no simple task, as discussed below), our statistical analysis identified a primary indicator that at first seems obvious, but upon reflection is more surprising: vacation home starts are highly correlated, with a simple correlation coefficient of 0.84, to U.S. housing starts. Getting past the initial “no duh” reaction requires recognizing that vacation homes make up only 3.3% to 3.7% of the total housing stock in the U.S. (based on the 2000 and 2010 U. S. Censuses), so changes in second home construction would not be sufficient to significantly affect total housing starts. More importantly, it is not readily apparent that vacation homes should be so correlated to overall primary housing starts, which we assume to be driven by need and therefore tied to household growth, rather than want, or discretion.
The observation that the vacation housing market segment is so correlated to overall housing starts suggests that the vacation home segment is poised for broad recovery in the near term. Indeed, we are already seeing vacation home recovery in locations proximate to major metropolitan areas and in other exceptional development projects, which we expect to expand and continue, barring any external shocks to the economy and the recovering housing market. Actual performance will vary based on local market supply and demand conditions, but many vacation home developers whose markets have not yet shown much improvement should begin to see it 2014. It is therefore time to ensure that you have the right housing products, segmentation, and brand/marketing message for the increasingly vital vacation home market.
The Dependent Variable: Vacation Home Construction
A fundamental challenge in attempting to quantitatively evaluate the primary indicators of vacation home performance is a severe lack of data on vacation home performance in the U.S. NAR’s data on annual sales and median prices of vacation homes is the best source, but it dates back to only 2003—effectively just one real estate cycle. We also reviewed data from the U.S. Census Bureau’s Housing Vacancy Survey, which does track housing units held for seasonal, recreational, or occasional use, but we found the data to be far too inconsistent from quarter to quarter or year to year to be useful to quantify second home construction volumes.
Recognizing that no long-term data source on national vacation home activity exists, we ultimately elected to focus our research on home permitting activity in the 53 counties in the U.S. in which at least 50% of the housing units are held for “seasonal, recreational, or occasional use” according to U.S. Census data (“High-Concentration Vacation Home Counties”).2
The dependent variable in our analysis is therefore total annual housing permits in these counties as reported by the U.S. Department of Housing and Urban Development (HUD), going back to the year 1980. We find this to be an attractive data source to represent national vacation home performance for the following reasons:
- It offers a sufficient number of years (33) to be able to demonstrate statistical correlations with some confidence;
- Despite the fact that it is not possible to distinguish between primary and second home permits in the permit data, we are confident that it represents a fairly “pure” indicator of vacation, or at least discretionary, housing activity. In these heavy tourism markets, even primary home construction would be either largely discretionary (who else besides those with greater capacity for leisure could afford to live there?) or for those households either directly or indirectly living there because of the tourism industry and the spending of second home owners; and
- It correlates very well with the NAR second home sales data for the period 2003 to 2012: the simple correlation coefficient between the two data sources is a very strong 0.90, although NAR second home sales began to recover in 2009 while permits in the High-Concentration Vacation Home Counties stayed at or near the bottom into 2012.
The Independent Variables: Primary Housing Starts Are Most Important
The vacation home industry has traditionally looked at anecdotal evidence to understand the drivers of vacation demand. These observations point to both demographic factors, such as the number of households in their “peak” vacation home buying years, and economic factors, such as stock market performance and consumer confidence, as the reasons why some time periods see good sales performance while other lag. The lack of a good dependent variable to reflect vacation housing performance, however, has not allowed the vacation home industry to pinpoint potential indicators (or independent variables) that suggest when the market is waxing or waning.
We performed a series of statistical regression analyses to identify these indicators, employing as our dependent variable the annual permitting activity in the High-Concentration Vacation Home Counties, where vacation homes account for the highest percentage of housing units:
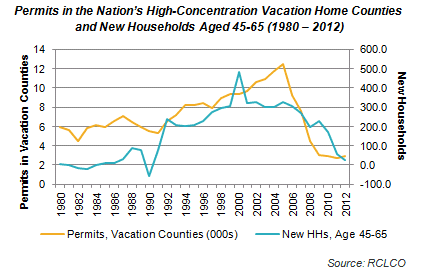
- Demographic Indicators: Both anecdotal evidence and the Federal Reserve’s Survey of Consumer Finances identify the peak vacation home owning ages of American households as 45 to 65. We therefore evaluated the potential relationship between the annual change in number of these households from 1980 to 2012 and vacation home performance, and found it to be moderately correlated (simple correlation of .68). This relationship explains the long-term trends more than any cyclical trends, however: as the following figure demonstrates, as the Baby Boomer generation reached these peak buying years in the late 1990s/early 2000s, vacation home construction swelled. Looking forward, therefore, as Baby Boomers increasingly pass the age of 65, we’d expect long-term vacation home demand to moderate, though this will not explain cyclical performance.
- Economic Indicators. Those involved in selling vacation homes know that prospective buyers must feel especially confident about their economic situations to be able to make this largely discretionary purchase. We therefore know home brokers in Colorado and Utah ski resort markets who regularly track bonus performance among New York City financial services firms to be able to predict what kind of a sales year it will be. The indicators that we tested include:
- U.S. gross domestic product (GDP), as reported by the U.S. Bureau of Economic Analysis (BEA);
- U.S. Business Confidence, as reported by the Institute for Supply Management (ISM);
- U.S. Consumer Spending, as reported by the BEA;
- U.S. Disposable Personal Income, as reported by the BEA;
- U.S. Personal Savings Rate, as reported by the BEA;
- S&P 500, adjusted for inflation; and
- U.S. Consumer Confidence, as reported by the Conference Board.
Our analysis found that Consumer Spending and Consumer Confidence are both positively correlated with vacation home performance (0.609 and 0.623 correlations, respectively), while Personal Savings is negatively correlated (-0.513). Those looking to anticipate the direction of the vacation home industry should therefore pay attention to these broad indicators, particularly in relevant source markets.
- Housing Indicators. In addition to the economic indicators listed above, we also evaluated a range of housing-specific variables, reflecting the observation that the performance (indicated by both prices and activity) of primary housing can also affect second home performance, perhaps in part because prospective vacation home buyers gain greater confidence when their primary home values increase. Specific variables tested include:
- U.S. Housing Starts, as reported by the United States Census Bureau. This includes all privately-developed housing in the U.S.
- Case-Shiller Home Price Index, adjusted for inflation, as reported by Standard and Poor’s.
- 30-year-fixed mortgage interest rates, as reported by Freddie Mac.
Annual changes in resale home prices, as reported by Case-Shiller, have a moderate correlation (0.606) with vacation home construction activity. In our view, this likely suggests both a driver and component of the consumer confidence and spending correlations observed above. We were not able to observe any correlation between mortgage interest rates and vacation home performance.
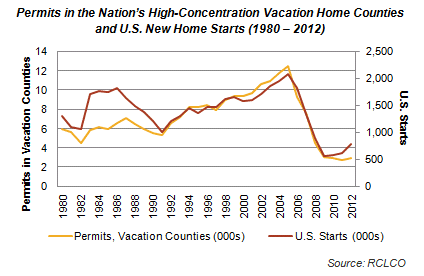
Of all the variables tested, the number of U.S. housing starts has the highest correlation with observed vacation home performance (0.84) from 1980 to the present. We do not believe this is due to any impact that the vacation home market has on overall U.S. housing starts, as the number of vacation home starts in our analysis is a tiny fraction of the total, but rather that both U.S. housing starts and second home permits are driven by the same or similar variables and perhaps because households are more likely to have the confidence to buy a second home when the primary home market is vibrant. The following figure demonstrates this relationship.
Implications of the Finding
As mentioned above, this finding, on the face of it, might seem obvious until we recognize that primary housing and vacation housing might be expected to have very different drivers: a primary home is a need; a vacation home is a want. So why do they perform in such a similar way?
We suspect that the underlying drivers of primary and second homes are potentially not so different after all. Household growth certainly matters for both, and household formation (which occurs when adult children are secure enough to leave the nest, couples are financially flexible enough to separate, etc.) may result from the same economic confidence indicators that have been demonstrated to drive vacation home demand.
Of more immediate importance to the vacation home industry, this analysis suggests that in a typical housing market recovery period, vacation home performance would have begun to improve several years ago in all types of second home areas. As the figure above demonstrates, U.S. housing starts have experienced a significant uptick in the past three years, without a corresponding increase in permits in the High-Concentration Vacation Home Counties. Thirty-three years worth of data would suggest that this is due to change, particularly as we see continued improvements in consumer spending and confidence. Indeed, RCLCO vacation home clients in more desirable locations (e.g., closer to major metropolitan areas and/or in exceptional destination areas) have already been benefitting from improving market conditions. Furthermore, permits in popular vacation home locations with lower concentrations of vacation homes increased markedly in 2012, and dramatically in 2013 through August relative to the same months in 2012. Our analysis of factors that are correlated with vacation home permits leads us to anticipate improvement across all categories of vacation home markets, assuming (as we believe is likely) that the economy continues to expand and experiences no external economic shocks. This is consistent with consumer research that demonstrates the continued desirability of vacation homes. Indeed, high net worth households are more likely to express an interest in purchasing a vacation home within 12 months than at any time since Spring 2007.3
Owners of and investors in vacation residential properties in areas that have not yet begun to recover should begin to experience stronger demand in the near term. Resort developments should ensure that residential offerings, amenities, and other programs are up and running and aligned with what today’s target market demands, and speed to market is likely now of the essence for projects that are proposed or in early stages of development.
Conclusion
This analysis aims to fill a gap in the industry’s understanding of vacation-oriented residential, as we are not aware of any previous analysis that quantitatively identifies or measures the macroeconomic and demographic indicators of vacation home performance. After identifying a suitable variable to represent vacation home performance (housing permits in the 53 U.S. counties in which over 50% of the housing units are vacation homes according to the U.S. Census), we identified via regression analysis several correlated economic factors. Of most interest is the strong correlation between vacation home starts and total housing starts, which suggests that both are driven by similar economic factors and that vacation housing should continue to recover strongly in the more desirable locations and begin to experience a rebound more broadly in the near term.
1Federal Reserve, “Survey of Consumer Finances,” 2010.
2Many popular tourism and vacation home destinations—particularly counties relatively close to major metropolitan areas or that are exceptional vacation destinations such as the best ski resorts and beaches—have large permanent, but seasonal, populations, and so are not included in the set of High-Concentration Vacation Home Counties. However, we are confident that our analysis is a valid proxy for the second home industry as a whole.
3American Affluence Research Center, Affluent Market Tracking Study, Fall 2013 and earlier dates.
Article and Research prepared by Taylor Mammen, Principal/Director of Consulting, and CJ Faulwell, Associate
RCLCO provides real estate economics, strategic planning, management consulting, and implementation services to real estate investors, developers, financial institutions, public agencies, and anchor institutions. Our real estate advisors help clients make the best decisions about real estate investment, repositioning, planning, and development.
RCLCO’s advisory groups provide market-driven, analytically based, and financially sound solutions. RCLCO’s Community and Resort Advisory Group produced this newsletter. Interested in learning more about RCLCO’s CRAG? Please visit us at www.rclco.com/community-and-resort.
Related Articles


Speak to One of Our Real Estate Advisors Today
We take a strategic, data-driven approach to solving your real estate problems.
Contact Us