Evaluating the Top 25 Most Active Markets: A Look at Single-Family Housing Momentum

U.S. Metro Areas Driving the Housing Market
While the overall U.S. housing market has expanded since the Great Recession, it’s clear from the data that some metro areas have momentum that others lack. RCLCO identified the 25 most active metros[1] and ranked them relative to each other in terms of their potential for continued single-family homebuilding. RCLCO used lessons learned from nearly 50 years of industry experience, client insight, and our firm’s national and local market expertise to provide perspective on factors that contribute to demand for new single-family homes. The metros with the greatest momentum are generally, but not exclusively, areas with strong domestic net in-migration. The maps and charts below show our ranking along with the areas with the strongest domestic net in-migration.
Nationally, single-family housing construction activity has increased at a slower pace than in past economic recoveries, and the supply of homes for sale, measured by months of inventory and vacancies, is below long-term trends. Given tight resale inventory and a new home market priced out of reach for many entry-level consumers, a large share of potential buyers remain on the sidelines, contributing to a historically low homeownership rate. Meanwhile, average home size has continued to increase, driving new home prices higher, despite the fact that many among the two largest demographic cohorts, Millennials and Baby Boomers, are seeking smaller and more affordable housing options.
New and Existing U.S. Home Sales (Seasonally Adjusted Annual Rate); 1999-July 2016
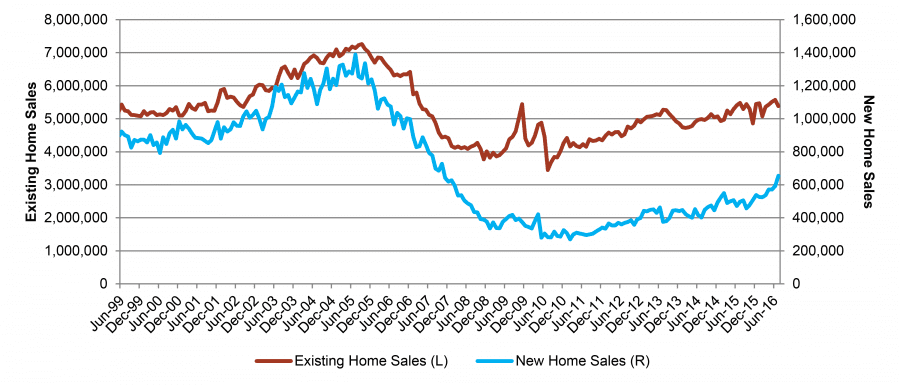
Nonetheless, demand conditions across the U.S. are strengthening as Millennials move into prime family formation ages, with 26-year olds representing the largest age group in the U.S., and Baby Boomers looking to downsize as their children move away. Additionally, recently published data from the U.S. Census Bureau indicates that the U.S. median real household income increased by 5.2% between 2014 and 2015, after years of income stagnation, though real incomes remain below 1999 and 2007 levels. These strong underlying demographic and economic fundamentals, coupled with substantial pent-up demand generated by household growth and years of housing undersupply, are likely to drive single-family housing demand in the near future.
For-Sale Housing Momentum Index
RCLCO developed a momentum index to identify for-sale housing markets with the most momentum, because local fundamentals tend to have greater cyclical impacts than those of national or regional fundamentals.[2] RCLCO analyzed the 25 most active single-family housing markets in the United States (since 2011) in order to focus on the most dynamic housing markets of most interest to larger investors and homebuilders. The top 25 markets were then ranked relative to one another based on each MSA’s share of national population and employment growth relative to its size, change in single-family building permits, and the current unemployment rate (see the Methodology section for additional details). The top-ranking markets are those with strong demand drivers and thus the best potential for further for-sale single-family homebuilding.
Due to its robust historical and projected growth of population, employment, and permitting activity, the Orlando MSA tops RCLCO’s For-Sale Momentum Index for the second quarter of 2016. Of the analyzed markets, Orlando ranks 1st in projected population growth through 2Q 2017, and demonstrated strong employment growth over the past 12 months relative to its share of U.S. jobs. Austin and Dallas-Fort Worth were close behind with similarly strong employment growth, benefiting from diversified economies and significant business relocations from other states. In 4th position on the list, Phoenix ranks 1st in projected employment growth through 2Q 2017, with strong expected expansion of Professional and Business Services, Education and Healthcare, and Construction sectors. Jacksonville, which rounded out the top five for-sale housing markets, ranked 2nd for employment growth last year and is projected to continue strong employment growth across multiple sectors, including Trade, Transportation, and Utilities, as Jacksonville continues to thrive as a major logistics center.
RCLCO For-Sale Housing Momentum Index
| RANK | METROPOLITAN STATISTICAL AREA |
|---|---|
| 1 | Orlando-Kissimmee-Sanford, FL |
| 2 | Austin-Round Rock, TX |
| 3 | Dallas-Fort Worth-Arlington, TX |
| 4 | Phoenix-Mesa-Scottsdale, AZ |
| 5 | Jacksonville, FL |
| 6 | Las Vegas-Henderson-Paradise, NV |
| 7 | Denver-Aurora-Lakewood, CO |
| 8 | Raleigh, NC |
| 9 | Atlanta-Sandy Springs-Roswell, GA |
| 10 | Seattle-Tacoma-Bellevue, WA |
| 11 | Tampa-St. Petersburg-Clearwater, FL |
| 12 | Miami-Fort Lauderdale-West Palm Beach, FL |
| 13 | Portland-Vancouver-Hillsboro, OR-WA |
| 14 | Nashville-Davidson–Murfreesboro–Franklin, TN |
| 15 | Charlotte-Concord-Gastonia, NC-SC |
| 16 | San Antonio-New Braunfels, TX |
| 17 | Minneapolis-St. Paul-Bloomington, MN-WI |
| 18 | Riverside-San Bernardino-Ontario, CA |
| 19 | Oklahoma City, OK |
| 20 | Washington-Arlington-Alexandria, DC-VA-MD-WV |
| 21 | Houston-The Woodlands-Sugar Land, TX |
| 22 | Los Angeles-Long Beach-Anaheim, CA |
| 23 | Philadelphia-Camden-Wilmington, PA-NJ-DE-MD |
| 24 | Chicago-Naperville-Elgin, IL-IN-WI |
| 25 | New York-Newark-Jersey City, NY-NJ-PA |
SOURCE: RCLCO; Moody’s; BLS
Strong Domestic In-Migration Fuels Hot Housing Markets
Metros demonstrating the most momentum are generally in states gaining the most from strong domestic net in-migration, driving supplemental demand in addition to natural population increases. Markets near the bottom of the list, such as Los Angeles, Philadelphia, Chicago, and New York, are located in states with large domestic net out-migration, including to markets at the top of the list, and are more dependent on natural increases and foreign migration.
Domestic Net Migration by State 2010-2015
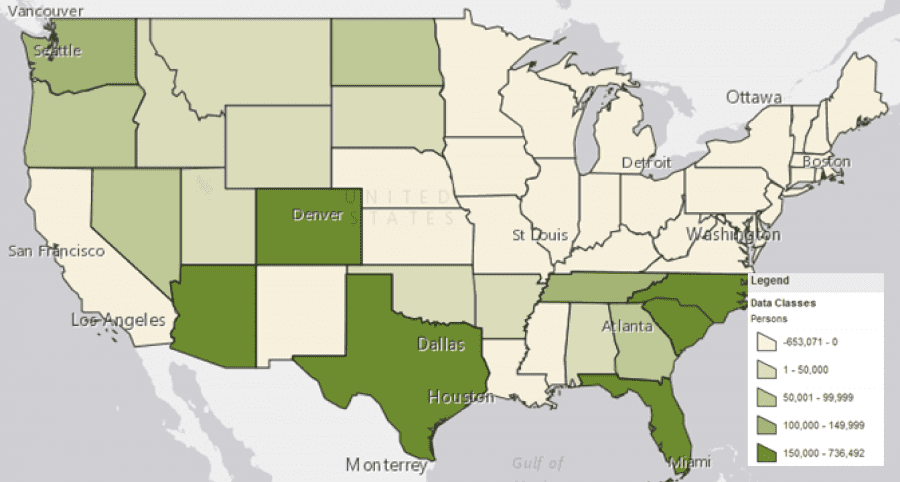
SOURCE: U.S. Census Bureau
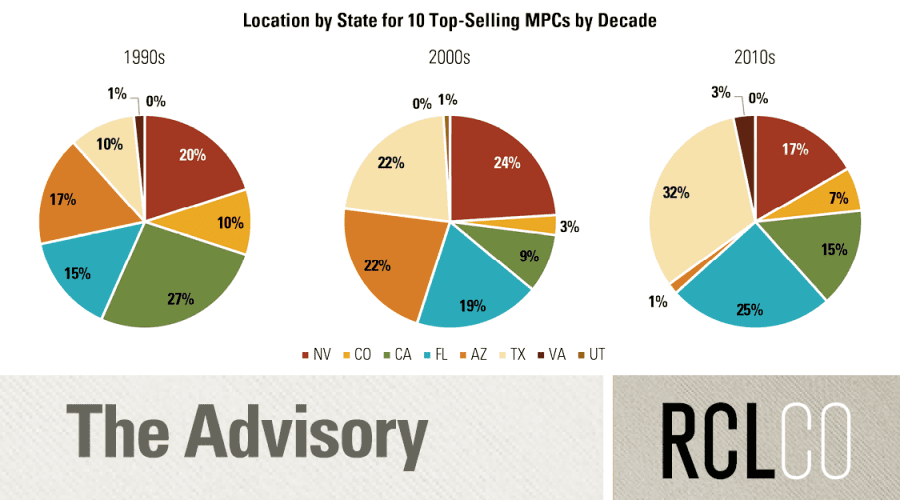
Florida (Four Metros)Florida is home to four of the top 12 MSAs on the Momentum Index and contains four of the nation’s top-selling master-planned communities (MPCs). An estimated 691 people moved to Florida between 2010 and 2015, per day, net of out-migration. Domestic net in-migration accounts for over 45% of total population growth or 357 people per day, with most people moving from cold-weather states in the Northeast (55% of domestic migration growth) and Midwest (30% of domestic migration growth). Additionally, foreign net in-migration accounted for nearly 42% of Florida’s population growth, or 334 people per day, largely originating from Central and South America. Continued net positive migration is crucial for Florida’s housing market given the state’s low birth rate, as natural population increase accounts for only 98 people per day or 12% of total population growth. |
Arizona and Nevada (Two Metros)While Arizona and Nevada attract limited foreign migration, domestic migration accounted for 47% (126 people per day) and 55% (77 people per day) of total population growth between 2014 and 2015, respectively. California and Illinois serve as the largest source markets for domestic migration for both Arizona and Nevada. Though these states share many similarities, Arizona’s higher birth rate induces a larger share of population growth from natural increases at 35% (94 people per day) versus Nevada’s 27% (37 people per day). |
Colorado (One Metro)Colorado’s annual rate of population growth has increased significantly from 189 people per day in 2011 to over 273 in 2015. However, since 2010, Colorado’s population growth from natural increase has declined both nominally and as a share of total population growth, declining from 51% to 32%. Between 2014 and 2015, domestic net in-migration accounted for nearly 150 new residents per day versus 68 just five years before. People are migrating from nearly every state, with the top five source markets of Illinois, California, New York, Pennsylvania, and New Mexico accounting for only 39% of total domestic migration, compared with 45% to 65% for most other high-growth states. |
Texas (Four Metros)Despite declining oil prices, the state of Texas was still the 3rd largest job creator between 3Q 2015 and 2Q 2016, leading to continued strong in-migration both domestically and internationally. An estimated 466 people moved to Texas from within the U.S. every day between 2014 and 2015, with a significant share of people moving from other large states such as Florida, California, Georgia, Illinois, and New York. In addition, Texas’ adjacency to an international border led to a sizable inflow of foreign migration, accounting for approximately 278 people per day or 21% of population growth, with most foreigners migrating from Mexico and Central America. Lastly, the large existing population and high birth rates in Texas led to large natural increases in population, though fertility rates have been stagnating as the growth from natural increase has remained relatively constant since 2010, adding between 570 and 590 people daily. |
California (Two Metros)How is it that so many California MPCs continue to make RCLCO’s Top Selling MPC list, despite the press reports that Californians are leaving in droves? California has created more jobs than any other state over the past five years and was the top destination for foreign migration in the United States between 2010 and 2015, with 458 foreigners moving to California every day, net of out-migration. Furthermore, natural population increase has accounted for approximately 730 new people per day over the past five years. Though job growth and foreign migration are robust, there is significant domestic net out-migration, with approximately 146 residents leaving California every day for other states, including Texas, Nevada, and Oregon. In contrast to Texas and many of the other rapidly growing states, California is heavily dependent on foreign migration and natural population increase for continued housing demand. |
It’s important to note that this data measures momentum looking ahead the next 12 months, and capitalizing on that momentum requires that builders and developers offer new homes congruent with homebuyer affordability levels. It’s similarly important to note that by this time next year most real estate product types may be in the late stable stage of the cycle, so economic conditions should be carefully monitored as circumstances may change. Continued strong growth in median new home prices may dampen demand potential in some markets. We plan to update this information periodically and adjust as we move through the housing cycle.
Methodology
We looked at a variety of leading and lagging metrics to determine the for-sale housing markets with the most momentum among the 25 most active housing markets—those with the greatest single-family permitting activity from 2011 to 2015. Our analysis focused on metrics in four main areas that drive demand for new, for-sale housing: single-family permits, population growth, employment growth, and low unemployment levels. We ranked each MSA’s fair share of national growth relative to each other (an MSA’s fair share describes the MSA’s share of growth over a period of time relative to its share at the beginning of the time period). In total, we looked at 10 different indicators among the four categories to analyze each of the 25 markets. Moody’s Analytics’ historical and projected economic and demographic data were used for this analysis.
Overall population change information, including data regarding natural increase and migration, is from the U.S. Census Bureau’s annual Population Estimates and Components of Population Change. Detailed information about domestic migration from state to state is derived from IRS Statistics of Income U.S. Population Migration Change, which uses Forms 1040 to track domestic migration between 2013 and 2014.
Want to learn more about migration or demand drivers fueling single-family, for-sale housing growth in your local market? Contact RCLCO’s Community and Resort Advisory Group.
References
[1] Based on single-family permitting from 2011 to 2015.
[2] Robert H. Edelstein and Desmond Tsang, “Dynamic Residential Housing Cycles Analysis,” Journal of Real Estate Finance and Economics, July 2007
Article and research prepared by Gregg Logan, Managing Director; Todd LaRue, Managing Director; and Cameron Pawelek, Vice President. Additional research assistance conducted by Alan Rios, Summer Intern.
RCLCO provides real estate economics and market analysis, strategic planning, management consulting, litigation support, fiscal and economic impact analysis, investment analysis, portfolio structuring, and monitoring services to real estate investors, developers, home builders, financial institutions, and public agencies. Our real estate consultants help clients make the best decisions about real estate investment, repositioning, planning, and development.
Disclaimer: Reasonable efforts have been made to ensure that the data contained in this Advisory reflect accurate and timely information, and the data is believed to be reliable and comprehensive. The Advisory is based on estimates, assumptions, and other information developed by RCLCO from its independent research effort and general knowledge of the industry. This Advisory contains opinions that represent our view of reasonable expectations at this particular time, but our opinions are not offered as predictions or assurances that particular events will occur.
Related Articles


Speak to One of Our Real Estate Advisors Today
We take a strategic, data-driven approach to solving your real estate problems.
Contact Us