Rutabaga, Radicchio, and Rent Growth: Measuring the “Whole Foods Effect” on Market-Rate Apartments
Introduction
The arrival of a Whole Foods in a gentrifying area is commonly seen as an indicator that a neighborhood has “made it” and is often met with equal parts celebration and derision. Much like the presence of high-end yoga studios, chunky eyewear, or top-knot hairstyles, Whole Foods represents the changing face of a community—a bellwether of positive evolution or harbinger of displacement, depending on one’s perspective. Regardless, a new Whole Foods or Trader Joe’s is one more signal of the changing landscape of the nation’s urban centers.
The theoretical impact that the well-known grocer can have on a neighborhood, the so-called “Whole Foods Effect,” has, up until this point, been studied through a limited number of lenses. Previous investigations (and satirical takedowns) have focused on the qualitative impacts on the culture of a neighborhood, and any quantitative studies have been limited to the impacts of value of nearby land or for-sale homes. Questions about what effect the presence of a Whole Foods has on market-rate rents or, more importantly, the value of a real estate investment from the perspective of an owner or developer, have been left largely unanswered.
Recognizing this gap in research, RCLCO undertook the following study to better understand and document the impacts that a Whole Foods or Trader Joe’s on the ground floor has on the rental apartments above. This effort was positioned from the perspective of a real estate developer or investor and sought to answer the following key questions:
- What premium, if any, does a ground-floor Whole Foods or Trader Joe’s generate for rental apartments located directly above the store? In other words, if there were two identical rental buildings in the same location, one with a popular grocer as a tenant and the other without, how would the rents compare?
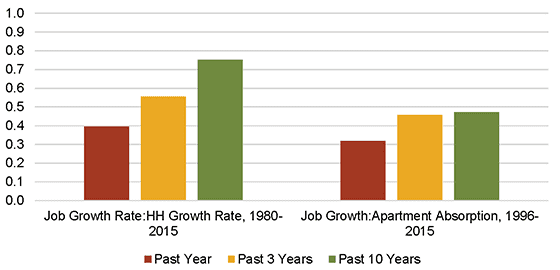
- How does the presence of a Whole Foods or Trader Joe’s on-site impact rental growth rates over time?
- When a brand-new building delivers with a Whole Foods on the ground floor, does the building capture a higher percentage of overall demand during lease-up?
Key Findings
RCLCO conducted a peer group analysis using historical rental market data for over 50 apartment buildings in more than 10 different submarkets across the country to find out if the “Whole Foods effect” documented in for-sale housing would carry over into the rental apartment market. By comparing the performance of buildings with an on-site Whole Foods or Trader Joe’s to analogous new rental buildings in the same submarket and/or neighborhood, we isolated the impact of attracting a specialty grocer on a new rental apartment development.
Rental Premium
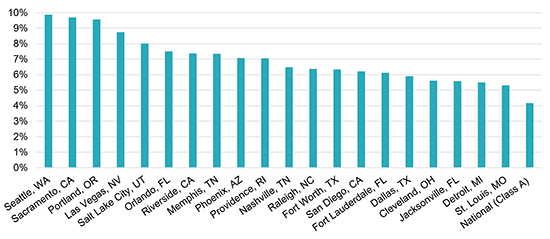
Rental buildings with a Whole Foods or Trader Joe’s on the ground floor enjoy, on average, a rental premium of 3-4% above their nearest competitors after adjusting for key quantitative and qualitative differences. Whole Foods commands an average premium of 4.3%, which is higher than Trader Joe’s at 3.2%.
Whole Foods vs. Trader Joe’s Premium by Market
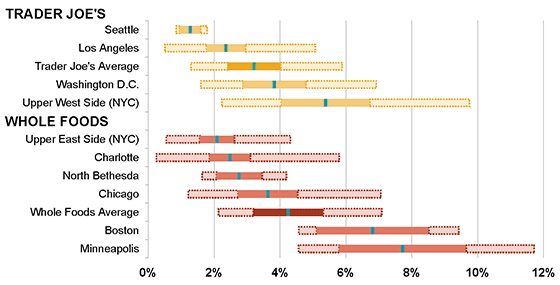
Source: RCLCO, Axiometrics
Rental Growth
Whole Foods buildings saw stronger rent growth than their peer competitors, 7% compared with 5%. Trader Joe’s buildings largely underperformed their submarket and peer competitors on rent growth, suggesting that the majority of is Trader Joe’s impact is reflected in initial rents but perhaps not sustained over multiple years.
Year-Over-Year Rent Growth 2013-2015
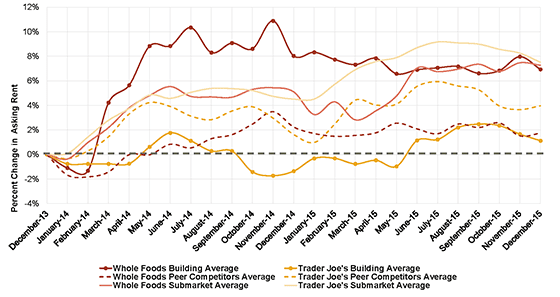
Source: RCLCO, Axiometrics
From year-end 2013 to year-end 2015, Whole Foods buildings saw average rental growth rates rise 6.9% over this 24 month period, which was slightly below the submarket average of 7.3% but well above their peer competitors (1.7%). By contrast, Trader Joe’s buildings saw an average rent growth of only 1.1%, compared with 4.0% for the peer communities in their submarket and 7.5% in the submarket as a whole. Once again, Whole Foods demonstrates a superior impact on rents compared with Trader Joe’s, which benefited from the initial rental premium but then did not outperform rental growth among their submarkets or peers.
Absorption Pace
These grocers are no guarantee of faster absorption, but perform at least on par with “fair share” expectations.
Absorption Pace of New Whole Foods Building
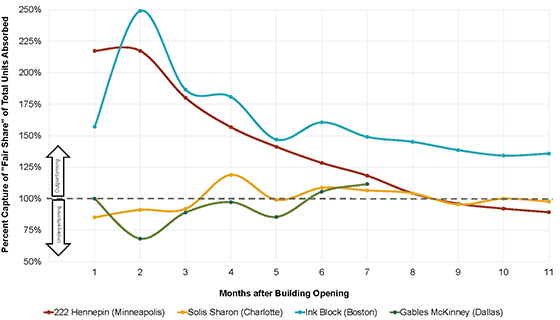
Source: RCLCO, Axiometrics
In two markets that were investigated, Minneapolis and Boston, the Whole Foods communities largely outperformed their expected capture rates, particularly during the first months of lease-up. Conversely, in both Dallas and Charlotte, these comparable new communities absorbed units more or less on pace with their “fair share” of total demand in that submarket.
The “Whole Foods Effect” Is Very Real and Very Valuable
Clearly, an on-site Whole Foods has a positive impact on rents and rental rate growth for the apartments located above the store. The effects on absorption pace are less consistent, but appear to improve the initial months of lease-up in certain markets. Trader Joe’s, while certainly demonstrating some net positive impact on asking rents, does not appear to have the same impact on rent growth. Even after documenting these current and historical positive impacts, questions remain about the longevity of this “Whole Foods Effect,” particularly as buildings age and markets become saturated with high-end grocery and food options. However, one thing is certain: a Whole Foods in a rental building, regardless of submarket, is a significant boon to rental rates, rent growth, and absorption pace.
Methodology
Rental Premium
In order to determine the rent premium that a ground floor Whole Foods or Trader Joe’s creates for a rental apartment community, RCLCO analyzed six Whole Foods buildings and four Trader Joe’s buildings across 10 different regions and submarkets. After selecting each case study, we then identified two nearby buildings within each submarket that were similar in terms of age, type of construction, level of finish, and overall amenity package. We collected the average gross rent and rent per square foot for a one-bedroom apartment for the month of February 2016. This average value ratio (on a PSF basis) was then adjusted to match the average size of a one-bedroom in the competitive set, and then further adjusted to control for other quantifiable differences between the peers, such as building age, Walk Score and Transit Score, and community and building finishes. The resulting adjusted rents were then compared to the average one-bedroom rent in the grocer-anchored case study building.
RCLCO further modified this adjusted difference in rents to account for intangible or unknown factors. For this analysis, we are only attributing 30-50% of this difference in adjusted rent per square foot to the presence of a grocer. This is a relatively conservative estimate, as the actual premium could be higher than what is presented here. However, the adjusted difference in rent could be ascribed to a myriad of intangible factors such as building management, consumer preference, or immediate site context, so we have adopted this conservative posture to control for those potentially meaningful but unknown factors.
Rental Growth
For this component, RCLCO restricted the study to buildings that had at least 12 months of data available, which limited the dataset to four Whole Foods buildings and four Trader Joe’s buildings in eight different submarkets.
Using average rents as reported on a monthly basis, RCLCO looked at the 2013-2015 year-over-year rent growth of the selected case study buildings, and compared that rental rate growth to all buildings delivered within a year of the case study property in the same submarket and/or neighborhood, which may or may not include the competitive peer buildings used in the rental premium analysis. Their average rents were then indexed to a starting value of 100 based on December 2013 levels. The chart above demonstrates how the rents changed over the subsequent 24 months.
Absorption Pace
RCLCO selected four buildings in four different submarkets that had monthly data available on lease-up rates. RCLCO compared the actual capture rate of the case study building against its “fair share” of the submarket’s net absorption relative to other newly delivered buildings in lease-up each month. This “fair share” capture rate estimate was calculated based on the overall percentage of new units in the submarket. For example, if 1,000 units (including the case study building) were in lease-up at the same time, the “fair share” capture rate for a case study building of 200 units would be 20%. Buildings that capture more units than their “fair share” can be said to be outperforming the submarket, compared with those buildings absorbing units in-line or below their “fair share” of demand.
Properties Summary
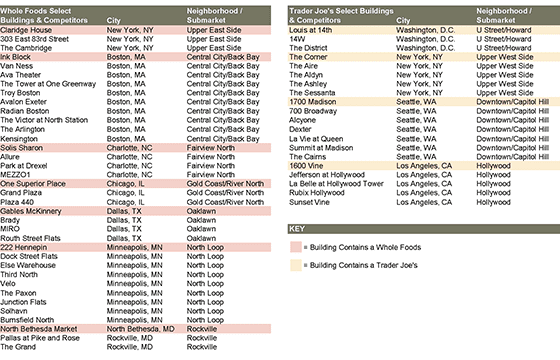
Source: RCLCO, Axiometrics
Disclaimer: Reasonable efforts have been made to ensure that the data contained in this Advisory reflect accurate and timely information, and the data is believed to be reliable and comprehensive. The Advisory is based on estimates, assumptions, and other information developed by RCLCO from its independent research effort and general knowledge of the industry. This Advisory contains opinions that represent our view of reasonable expectations at this particular time, but our opinions are not offered as predictions or assurances that particular events will occur.
Related Articles


Speak to One of Our Real Estate Advisors Today
We take a strategic, data-driven approach to solving your real estate problems.
Contact Us