Market Monitor California on Top and Bottom: Sacramento Leads the Nation in Annual Class A Rent Growth as San Francisco, San Jose Falter in 2016
At 12.7%, Sacramento Leads the Nation’s Largest Markets in Class A Apartment Rent Growth
Sacramento, also known as the City of Trees, has apartment owners made in the shade with a 12.7% increase in Class A apartment rents over the last year. This impressive jump in rents follows several years of sustained rising rents; since 2011, Sacramento’s rent growth has trailed only Seattle and Portland, and the city placed second in a mid-year 2016 comparison of rent growth. The metro area’s rent increases have been fueled in part by impressive job growth, with total non-farm employment growing by 2.8% over the last 12 months compared with the national average of 1.4%, coupled with a limited supply pipeline. Of the nation’s top-20 performing rental markets, Sacramento’s supply deliveries as a percentage of existing inventory (0.5%) were the lowest recorded over the last 12 months. However, over 5,400 units are proposed or under construction, and likely to deliver in the metro area by 2018. This represents 3.4% of that region’s rental apartment stock and could tamp down future rent growth as this new product is absorbed.
San Francisco and San Jose Both Struggle with Negative Rent Growth as New Supply Increases, Employment Growth Slows
San Francisco and San Jose saw annual declines in Class A rents of 4.0% and 2.7%, respectively. This drop follows sustained periods of positive rent growth, with a five-year compound annual growth rate of 2.0% and 5.7%, for each. Over the last 12 months, San Francisco saw employment growth of 2.3%, which was below San Jose’s growth rate of 3.4%. Each annual increase, while above national averages, is well below the five-year average for each metro of 3.3% and 4.0%, respectively. This slowdown in employment growth has coincided with an influx of new product into each market, with each metro area adding approximately 2.0% to its total apartment stock over the past 12 months. This downward pressure caused by the increase in supply is likely to continue in 2017 as the rate of new deliveries increases the rental stock approximately 2.5% to 3.0%, 50 to 100 basis points above the 2016 rate.
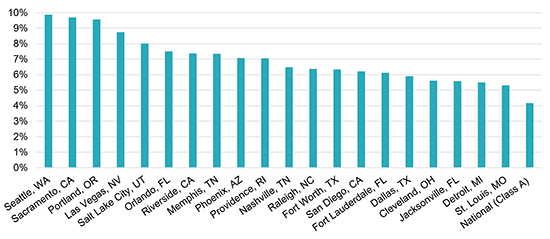
Top-20 Markets for Class A Apartment Rent Growth, Q4 2015–Q4 2016
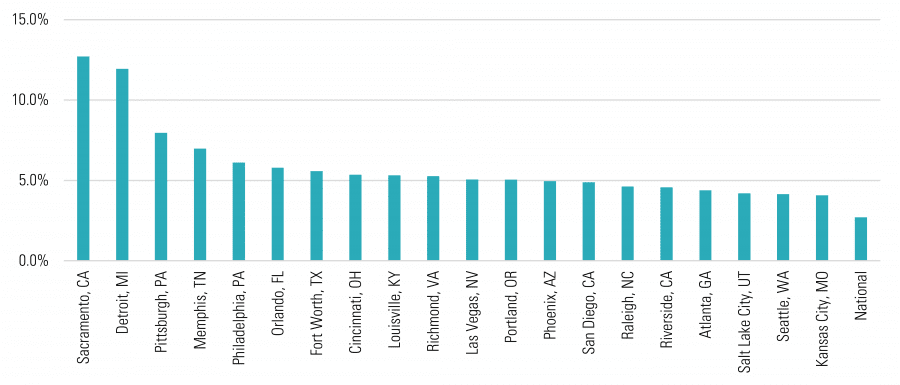
SOURCE: Axiometrics
Rust Belt Cities Demonstrate Surprising Year-End Growth, Reversal of Recent Trend
Among the top five markets, two Rust Belt cities showed surprising growth, leapfrogging the rent growth in perennial market leaders. Detroit saw year-over-year gains of nearly 12%, roughly three times the five-year average for the metropolitan average. The double-digit rent increase was enough to raise the city’s ranking by 13 spots, jumping from 15 to 2. Detroit’s impressive rent growth comes as the city’s Class A occupancy remains above 95% for the 13th quarter in a row. Strong job growth and limited new supply have contributed to the region’s strength. Even more dramatically, Pittsburgh climbed to third spot in the rankings, overcoming recent rent declines and more than doubling the region’s long-term average. The metropolitan area achieved rent growth well in excess of the five-year average of 1.4%, indicating positive economic tailwinds. However, more modest job growth and large supply pipelines suggest that the past year’s rent hikes may be aberrant. Philadelphia demonstrated an equally impressive turnaround, joining the top 5 with a 6.1% increase after a decline in rents in the mid-year analysis. Strong job growth figures, if these trends continue, will likely buoy rents, though the pipeline should be carefully monitored as multifamily supply in the region is expected to increase by 1.9% in 2017.
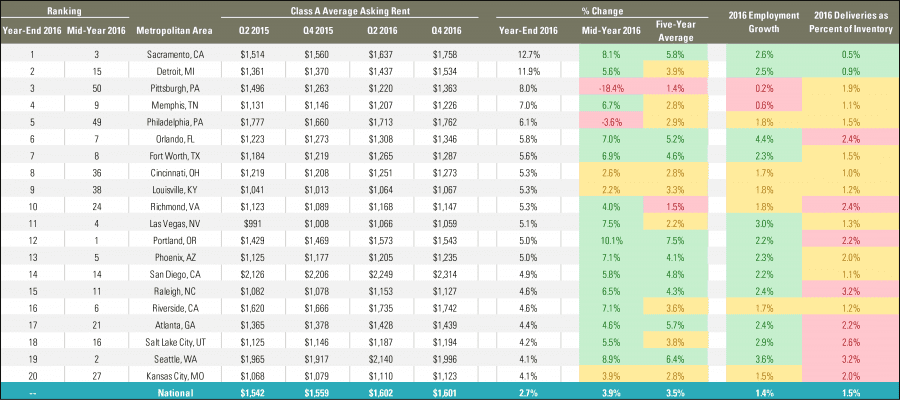
Top-20 US Markets for Class A Apartment Rent Growth, Q4 2015–Q4 2016[1]
Smaller, Lower Rent Markets Dominate the Top 20 List
The table above shows the top-20 metro regions for Class A rent growth in year-end, year-over-year rent growth. Other key indicators are also included: previous rental performance at mid-year 2016, five-year compound annual growth rate, 2016 employment growth, and new deliveries in 2016 as a percentage of inventories.
The colors for previous rent growth figures are in green if rent growth exceeded the national average. Yellow indicates rent growth above inflation but below the national average. Rent growth in red is below the rate of inflation.
Employment growth figures are green if they are 50 basis points above the national average, yellow if within 50 basis points of the national average, and red if more than 50 basis points below.
2016 deliveries as a percentage of inventory are green if deliveries are less than 1% of total inventory. Moderate deliveries of 1%-2% of inventory are in yellow. Red is reserved for markets that have had deliveries in excess of 2% of inventory.
Of the 20 major markets with the highest percentage rent growth in the past year, only five have Class A rents above the national average. Overwhelmingly, markets with lower rents and smaller populations have shown the most impressive rent growth: smaller markets such as Sacramento (1.5 million) and Memphis (1.3 million) outperformed larger, higher-cost regions like New York (20.2 million) and Los Angeles (12.8 million).
National Class A Rent Growth Falls Below Five-Year Average
National annual rent growth slowed from 3.9% at mid-year to 2.7% at the end of 2016. National rent growth fell below the five-year average (3.5%) for the first time in eight quarters. High levels of new deliveries in many markets will further exacerbate softening rent growth. Slowing growth rates may indicate that the national rental apartment supply/demand balance has tipped.
This echoes the conclusions of the recently published Chartbook, in which RCLCO projects that economic and demographic drivers are still increasing demand, though construction activity is catching up. As inventory nears equilibrium, net operating income (NOI) growth is positive but moderating. Multiple metrics and indicators suggest that we are in or nearing the “late stable” stage of the market cycle for rental apartments in most metros.
Full Rankings for Class A Apartment Rent Growth, Q4 2015–Q4 2016
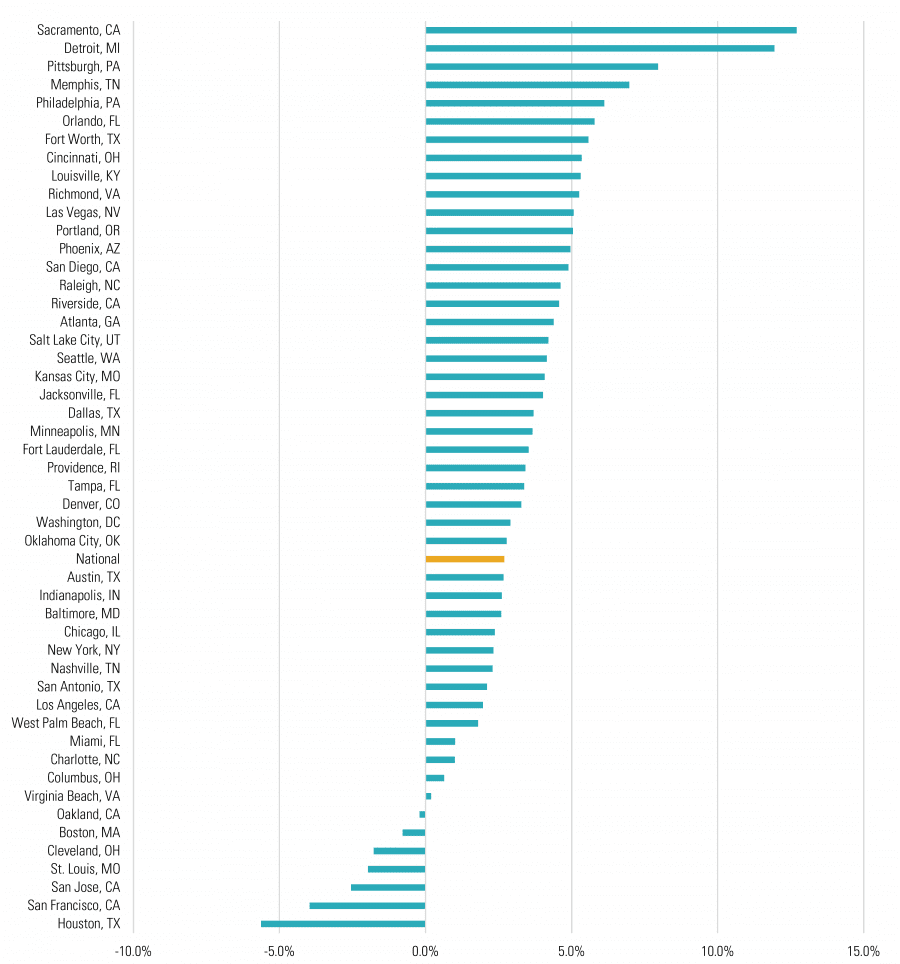
SOURCE: Axiometrics
References
[1] Q4 2015 data has been updated to reflect Axiometrics revisions incorporating stabilized Class A units.
Disclaimer: Reasonable efforts have been made to ensure that the data contained in this Advisory reflect accurate and timely information, and the data is believed to be reliable and comprehensive. The Advisory is based on estimates, assumptions, and other information developed by RCLCO from its independent research effort and general knowledge of the industry. This Advisory contains opinions that represent our view of reasonable expectations at this particular time, but our opinions are not offered as predictions or assurances that particular events will occur.
Related Articles


Speak to One of Our Real Estate Advisors Today
We take a strategic, data-driven approach to solving your real estate problems.
Contact Us