Why the Boom in Single-Family Rentals? Renters with Kids, but No Cash; Owners with Cash, but No Kids.
One of the most dramatic shifts in the U.S. market over the past decade has been the unprecedented increase in single-family home rentals (“SFRs”). While there has been widespread discussion of the economic and demographic shifts affecting the U.S. multifamily rental market, a major component of the overall rental market—single-family rentals—has been largely overlooked. Understanding the recent dramatic shifts in the single-family rental market is critical to having a complete picture of the overall U.S. housing market.
As we set out to better understand the key drivers of the single-family rental market, RCLCO asked the following questions: What are the characteristics of the rental market for single-family homes? What market conditions and actors have driven changes in single-family rentals over time? What are the economic and demographic characteristics of households living in single-family rentals?
Our research found that:
- Between 2005 and 2014, single-family rentals accounted for 88.9% of the net increase in occupied single-family stock and 62.5% of the increase in total occupied housing units.
- While institutional-investor-owned inventory comprises a tiny share of overall single-family rental stock, the ongoing institutionalization of the sector—as well as its staying power—are key indicators of the market opportunity.
- Single-family renter households predominantly consist of lower- and middle-income families with children, whereas single-family homeowners are much more likely to be older, wealthier, and not have children at home.
A Primer: Sizing Up the Single-Family Rental Market
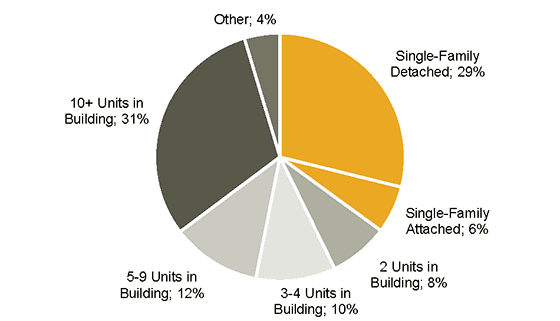
The 15.1 million rented single-family homes in the U.S. account for 13% of all occupied housing stock in the U.S. and make up over one-third of all occupied rental housing stock. In the U.S., there are roughly 117 million occupied housing units. Of these, 80 million are single-family (attached and detached), 30 million are in multifamily buildings with two or more units, and just under 7 million fall into other categories. Within this inventory mix, there are approximately 73 million owner-occupied housing units and 43 million renter-occupied units. Single-family detached homes made up the largest individual share of the rental housing stock, comprising 29% of the entire rental market in 2014. Combining that portion of the market with the share of townhomes (single-family attached), all single-family residences accounted for 35% of the occupied rental stock in 2014.
Distribution of Occupied Rental Housing Stock by Type in 2014
SOURCE: U.S. Census Bureau, 2014 American Community Survey 1-Year Estimates
The single-family rental market has seen explosive growth over the past decade; between 2005 and 2014, single-family rentals accounted for 89% of the net increase in total single-family occupied units in the U.S., adding 3.8 million units of occupied inventory. Between 2005 and 2014, the number of single-family detached rentals rose by 35%, from 9.1 million to 12.3 million, while the number of single-family attached rentals rose by 500,000.[1] During the same period, total occupied housing units increased by 6.5 million units, with single-family rentals accounting for 62.5% of total occupied housing growth.
Cumulative Change in Occupied Housing Inventory by Type and Tenure: 2005-2014 [2]
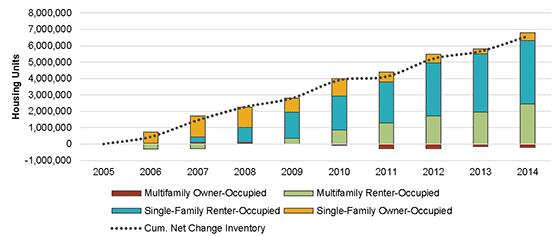
SOURCE: U.S. Census Bureau, Quarterly Starts and Completions by Purpose and Design, 2015
Single-family owner-occupied homes increased by just 482,000 units over the same period; the remaining growth was largely captured by rental units in multifamily buildings with 10 or more units (1.7 million units) and rental units in multifamily buildings with fewer than 10 units (750,000 units). Occupied inventory of all owned multifamily units fell by 200,000. By any standard, this represents a dramatic increase for the single-market rental market, both in absolute terms and relative to overall rental housing stock.[3]
The vast majority of SFRs are conversions of properties originally built for sale; as a result, single-family rental properties tend to be smaller and older than single-family owned homes.[4] However, recently released residential construction data from the U.S. Census highlights an interesting trend: new construction of purpose-built single-family rentals constitutes an increasing share of total single-family housing starts over time. This phenomenon is partially attributable to the decline in single-family housing starts following the Great Recession. However, RCLCO’s analysis suggests that, even after controlling for this declining volume of single-family starts, the proportion of single-family construction made up by purpose-built single-family rentals has risen substantially, as measured by comparing new SFR starts to the long-term average volume of single-family housing starts (approximately 1 million annually). This phenomenon is highlighted in the chart below. Prior to 2000, only 2.1% of new single-family homes were constructed as rentals; since 2000, this share has grown to 3.2%.
Purpose-Built SFR as a Percentage of Actual and Average Annual Single-Family Construction Starts: 1974-2015
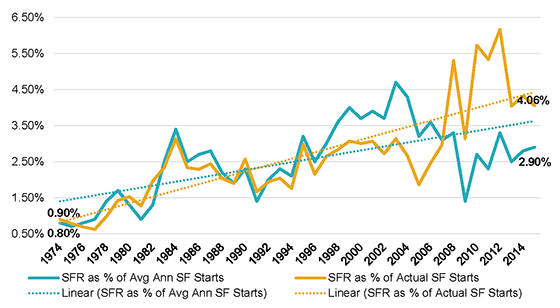
SOURCE: RCLCO; U.S. Census Bureau, Quarterly Starts and Completions by Purpose and Design, 2015
Lemonade Out of Lemons: Explaining the Unprecedented Boom in Single-Family Rentals
The oversupply of single-family for-sale homes and the collapse of housing demand resulting from the Global Financial Crisis set the stage for the single-family rental boom. With vast numbers of foreclosed properties on the market, extremely tightened mortgage lending standards,[5] and many middle- and lower-class households struggling with high unemployment and plummeting household income, home prices sank from 2007 to 2011. In the midst of this for-sale housing economic turmoil, investors looking for alternative market opportunities found that many single-family homes were substantially undervalued relative to the properties’ achievable market rents.
As a result, the single-family rental market began to attract attention from institutional investors. Due to the difficulties inherent in the monitoring, operation, and maintenance of large numbers of dispersed properties, the single-family rental market had historically been the province of small investors. However, the opportunity to acquire single-family homes at depressed prices and rent them was sufficiently compelling to attract a number of institutional investors to the space. By 2012, institutional acquisitions of undervalued and real-estate-owned properties were flourishing. To raise additional capital, portfolios of these single-family homes were securitized, led by Invitation Homes, a subsidiary of Blackstone Group LP. By December of 2015, the seven largest institutional-investor-owned SFR portfolios comprised approximately 170,000 properties,[6] and in just three years these same seven investor groups had completed 27 single-family rental securitizations, raising a combined $13.81 billion[7] for continued investment in single-family rental housing.
While institutional-investor-owned inventory comprises a tiny share (1.15%) of the overall single-family rental stock, which totals more than 15.1 million homes, the recent and ongoing trend of institutionalization of the sector—as well as its apparent staying power—are key indicators of the market opportunity today and in the future. Acquisition volume by institutional investors in the single-family rental space over the past decade has been heaviest in so-called “Sun Belt” markets, such as Phoenix, Atlanta, Tampa, Dallas, Houston, and Las Vegas.[8] Recently, as home prices have recovered, the pace of single-family rental acquisitions and institutional securitizations has slowed and institutional players have shifted focus to portfolio management and consolidation. Despite this recent slowdown, it appears that the sector has attracted, and will continue to attract, attention from institutional investors, and is worth paying attention to in coming years, particularly in light of the ongoing housing affordability and credit issues plaguing many U.S. housing markets.
Demand for Housing: Driven by Life Stage and Steered by Income
An individual household’s demand for housing can be understood at a high level as a function of the household’s demographic and economic characteristics. In this analysis, a household’s demographic characteristics are summarized into five “life-stage” categories: “Post-Graduates,” “Young Workers, No Kids,” “Families” (defined as households with children at home), “Middle Aged, No Kids,” and “Older Workers and Retirees, No Kids.” Life stage is important to consider because when a household has a significant change in demographic status, such as when a young couple has a child, housing type and tenure choices change significantly. In addition, a household’s home type and tenure options are limited by their income and wealth. To understand these economic characteristics, households’ ability to pay for housing is summarized in four market segments: affordable, workforce, market-rate, and luxury. A complete definition of these market and life-stage segments has been included in an appendix to this article.
National Results: Renters With Kids, but No Cash; Owners With Cash, but No Kids
Single-family renter households predominantly consist of families, who constitute 49% of the overall distribution of life-stage segments for this housing category. For lower- to middle-income households that are unable to afford homeownership, these homes (as compared with multifamily units) can offer the housing characteristics that are often preferred by families raising children. In addition, single-family rentals serve an important purpose for households that could otherwise afford homeownership but do not want to make the longer-term commitment entailed in purchasing a home.
U.S. Life-Stage Distribution Comparisons by Household Type
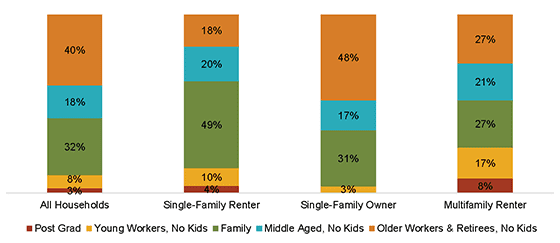
SOURCE: RCLCO; U.S. Census Bureau, 2014 American Community Survey 1-Year Estimates
The life-stage distribution of single-family owner households more heavily favors the “Older Workers and Retirees, No Kids” category (48% vs. 18% for SFR), who have had more time to build the income and savings required for homeownership and may have escaped the Great Recession relatively unscathed, at least from a housing perspective. On the other hand, multifamily renter households are less likely to be families than all other product types, suggesting that the decision to have children is a key driver of housing preferences.
Single-family rental properties overwhelmingly serve lower- and middle-income households. Among households occupying single-family rentals, nearly three-fourths (73%) fall within the affordable (49%) and workforce (24%) market segments. The affordable market segment is composed of all households with annual incomes of less than $35,000 as well as roommate and family households with incomes between $35,000 and $50,000. The workforce market segment is composed of single and couple households with incomes between $35,000 and $50,000 as well as roommate and family households with incomes between $50,000 and $100,000 (see appendix for full definitions).
The distribution of market segments for single-family rentals is in sharp contrast to the distribution for single-family owned homes, which is much more heavily weighted towards higher-income households; 57% of these households are in the top two economic segments, compared with just 26% of single-family renters. On the other hand, the percentage of households living in multifamily rental units and in single-family rentals that are in the lower income segments are similar. However, single-family renters are somewhat more likely than multifamily renters to fall within the somewhat more affluent workforce economic segment.
U.S. Economic Segment Distribution Comparisons by Household Type
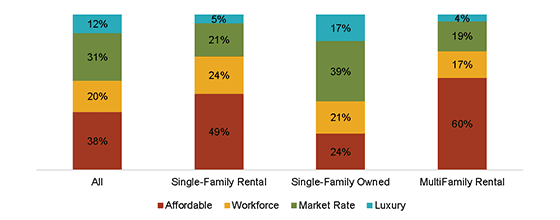
SOURCE: RCLCO; U.S. Census Bureau, 2014 American Community Survey 1-Year Estimates
Implications
Our research suggests that the predominant sources of demand for single-family rental properties are lower- and middle-income family households with children at home. Although economic conditions prevent many from accessing the wealth-building benefits that can result from homeownership, single-family rentals enable many households, particularly lower- and middle-income families, to obtain the other benefits of living in a single-family home.
Recent research suggests that, in spite of the economic turmoil faced by many budding homeowners in the foreclosure crisis, housing tenure preferences have not changed and single-family homeownership remains a core tenet of the “American Dream.”[9],[10] The persistence of these stated housing preferences suggests that many families renting single-family properties would buy a home if they could afford it and could qualify for a mortgage. However, if household income growth for lower- and middle-class Americans remains slow relative to historic gains and home mortgage standards do not loosen for subprime borrowers, it is likely that the recent boom in single-family rentals is here to stay.
References
[1] Rachel Bogardus Drew, “A New Look at the Characteristics of Single-Family Rentals and Their Residents,” Working Paper W15-6, Joint Center for Housing Studies at Harvard University, July 2015, accessed 3/15/2016 http://goo.gl/jLoKRl
[2] Note: Figure omits the “Other” category, which includes such unit types as mobile homes and boats.
[3] Harvard Joint Center for Housing Studies, “America’s Rental Housing: Expanding Options for Diverse and Growing Demand,” December 2015, accessed 5/6/2015, http://goo.gl/xjWhUn
[4] Taz George, “Three charts that explain the renters next door,” Urban Wire: Urban Institute, February 2015, accessed 5/5/2016, http://www.urban.org/urban-wire/three-charts-explain-renters-next-door
[5] Laurie Goodman, Jun Zhu, and Taz George, “Where Have All the Loans Gone? The Impact of Credit Availability on Mortgage Volume,” Urban Institute, March 2014, accessed 3/14/2016, http://goo.gl/ZnvkGo
[6] Desiree Fields, Rajkumar Kohli, and Alex Schafran, “The Emerging Economic Geography of Single-Family Rental Securitization,” Working Paper 2016-02: Federal Reserve Bank of San Francisco, January 2016, accessed 5/5/2016, http://goo.gl/oVYQNJ
[7] Brian Grow, “RMBS Commentary: Single-Family Rental Market Update,” Morningstar, December 2015, accessed 3/14/2016, https://goo.gl/7iiZCU
[8] Desiree Fields et al. “Emerging Economic Geography”, ibid.
[9] Rachel Bogardus Drew, “A New Look at the Characteristics of Single-Family Rentals and Their Residents,” Working Paper W15-6, Joint Center for Housing Studies at Harvard University, July 2015, accessed 3/15/2016 http://goo.gl/jLoKRl
[10] Rachel Bogardus Drew and Christopher E. Herbert, “Post-Recession Drivers of Preferences for Homeownership,” Housing Policy Debate 23, no. 4: 666-87, October 2013.
Appendix: Life-Stage and Market Segmentation Definition Matrix
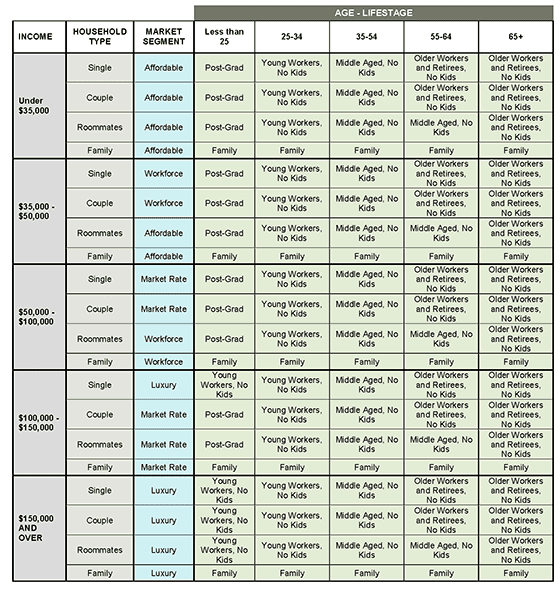
SOURCE: RCLCO
Article and research prepared by Cari Smith, Vice President, and Charlie Koch, Associate.
RCLCO provides real estate economics and market analysis, strategic planning, management consulting, litigation support, fiscal and economic impact analysis, investment analysis, portfolio structuring, and monitoring services to real estate investors, developers, home builders, financial institutions, and public agencies. Our real estate consultants help clients make the best decisions about real estate investment, repositioning, planning, and development.
RCLCO’s advisory groups provide market-driven, analytically based, and financially sound solutions. Interested in learning more about RCLCO’s services? Please visit us at www.rclco.com/expertise.
Disclaimer: Reasonable efforts have been made to ensure that the data contained in this Advisory reflect accurate and timely information, and the data is believed to be reliable and comprehensive. The Advisory is based on estimates, assumptions, and other information developed by RCLCO from its independent research effort and general knowledge of the industry. This Advisory contains opinions that represent our view of reasonable expectations at this particular time, but our opinions are not offered as predictions or assurances that particular events will occur.
Related Articles


Speak to One of Our Real Estate Advisors Today
We take a strategic, data-driven approach to solving your real estate problems.
Contact Us