November 16, 2023
In 2016 RCLCO and CapRidge Partners released the first STEMdex, an analysis ranking the momentum of the tech industry’s growth amongst the largest metropolitan areas in America. Since then, RCLCO has released an annual ranking of markets most likely to see the strongest STEM job growth in future years as a means of gauging momentum of one of the most impactful industries for the economy. The analysis focuses on the fifty largest Metropolitan Statistical Areas (MSAs, based on total population), which collectively account for 66% of total US jobs and 73% of total US STEM jobs(1). The aim of this analysis is to forecast the markets that are likely to experience strong growth due to demographic, quality of life, and business climate characteristics. Where STEM jobs will concentrate in future years is an important consideration in commercial and residential strategy planning due to the high earning potential of these roles and after multiplier impact on the economy they generate.
“The Tech industry has been the key driver for STEM jobs and local economies the past decade, but over the past 12-18 months that sector has slowed with company share prices down and hiring freezes being commonplace. Yet, the importance of Science and Engineering has never been greater with the advance of Life and Biosciences, EV plants, robotics in manufacturing, plus the heightened attention on infrastructure. That is strengthening sectors such as life sciences, data centers, and industrial. Thus, STEM continues to propel the economies forward that prioritize these areas. The 2023 STEMdex represents cities that continue to thrive by recruiting the best and brightest talent available, with Austin leading the way.”
– Dan Terpening, Chief Investment Officer of CapRidge
What are STEM Jobs?
STEM jobs are primarily, but not exclusively, concentrated in Science, Technology, Engineering, and Mathematics fields and represent some of the most economically productive roles in an economy. The profile of the workforce is typically more educated, younger, and diverse than the broader labor market. The average wage for STEM jobs among the fifty largest MSAs was $108,000 in 2022, compared to $67,000 for all other industries. The salary premium is greater than 45% in all studied markets save for Washington DC, which has a high concentration of strong earning, non-tech positions such as lawyers and lobbyists. These higher wages have a significant impact on the economy driven by the multiplier effect of employment, estimated to be greater than 2x industry wide, as supporting industries in manufacturing, logistics, and distribution concentrate around clusters of STEM jobs(2). Per a report from Science Is US, a consortium of leading science and engineering organizations, STEM jobs led to a collective economic impact of $9.45 trillion in 2021, or 40.5% of total United State Gross Domestic Product.
Methodology
The STEMdex utilizes 25 data points sourced from eleven different independent public and private databases such as the Urban Land Institute, The Bureau of Labor Statistics, Moody’s, and The American Community Survey, among others. We have identified these factors due to their historical correlation with past increases in STEM employment and feature both short- and long-term demographic and economic growth factors.
We have divided these metrics into four categories:
• In “Private Equity Real Estate Fund Performance: A Comparison to REITs and Open-End Core Funds,” Arnold, Ling, Naranjo (2021) find that closed end funds underperformed REITs and had comparable performance to NFI-ODCE, despite generally higher risk, over the 2000–19 period.
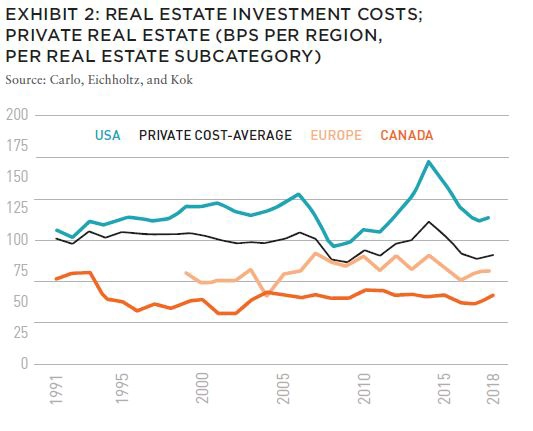
• Carlo, Eichholtz, and Kok (2021), in a PREA-sponsored report entitled “Three Decades of Institutional Investment in Commercial Real Estate,” found that pension funds in the US pay more to external real estate managers than their peers in Canada and Europe. (see Exhibit 2) In addition, investments costs (not including carried interest and promotes) averaged 180 BPS for external approaches, compared to 35 basis points for internal approaches.
• In “Performance of Non-Core Private Equity Real Estate Funds: A European View (2015),[5] Sami Kiehelä and Heidi Falkenbach found that PERE funds that invested in Europe delivered an average (median) IRR of –1.3%. There are other papers and articles that have addressed private real estate closed end fund performance. Those that we have reviewed have come to generally similar conclusions.
Closed-end funds remained the most popular investment product for institutions in 2023, with 80% of all survey participants expressing interest.
Includes population growth metrics, industry specific growth, and STEM wages. The top MSA’s in this category include Austin, Seattle, Portland, and Denver.
Measures educational attainment and millennial/Gen-Z population factors. The leaders in this category include Austin, San Jose, and San Francisco.
Factors included in Quality of Life include cost of living, walk scores, and commute times. The highest quality of life markets include Minneapolis, Salt Lake City, and St. Louis.
Includes cost of doing business factors such as office costs and the local tax environment. Business Climate is actually inversely correlated with current Location Quotient levels; however, it does remain an important factor for individuals and businesses that are considering relocation or expansion. The most favorable markets are primarily in the Sunbelt and include Dallas, Houston, Denver, and Orlando.
RCLCO reviewed past results of the STEMdex and employment growth within the studied markets to assign weights to the categories based on their correlation to STEM job growth. Markets with a high concentration of employment in a specific industry tend to draw in additional investment from new firms due to access to talent, existing logistical infrastructure, and lifestyle amenities. As such STEM jobs are likely to continue to expand in markets that already feature a high concentration of them and existing STEM concentrations and economic infrastructure are given a high weighting in the model.
The highest concentrations of STEM employment in the US today are in San Jose (Silicon Valley), Washington DC, San Francisco, Austin, and Seattle. Additionally, other cities in the top ten for most current STEM employment include markets with young, educated populations such as Boston, Raleigh, and Denver. Quality of life and access to lifestyle amenities remain important for families and workers considering where they want to work. The availability of hybrid or fully remote employment was the largest driver of migration from major cities who have comparatively higher costs of living. Knowledge based employment tends to have a higher degree of remote work and office attendance remains suppressed in markets with a high cost of living.
That said, the STEMdex is designed to predict where growth will be going over the next five to ten years, with current concentrations of jobs representing only a portion of the model.
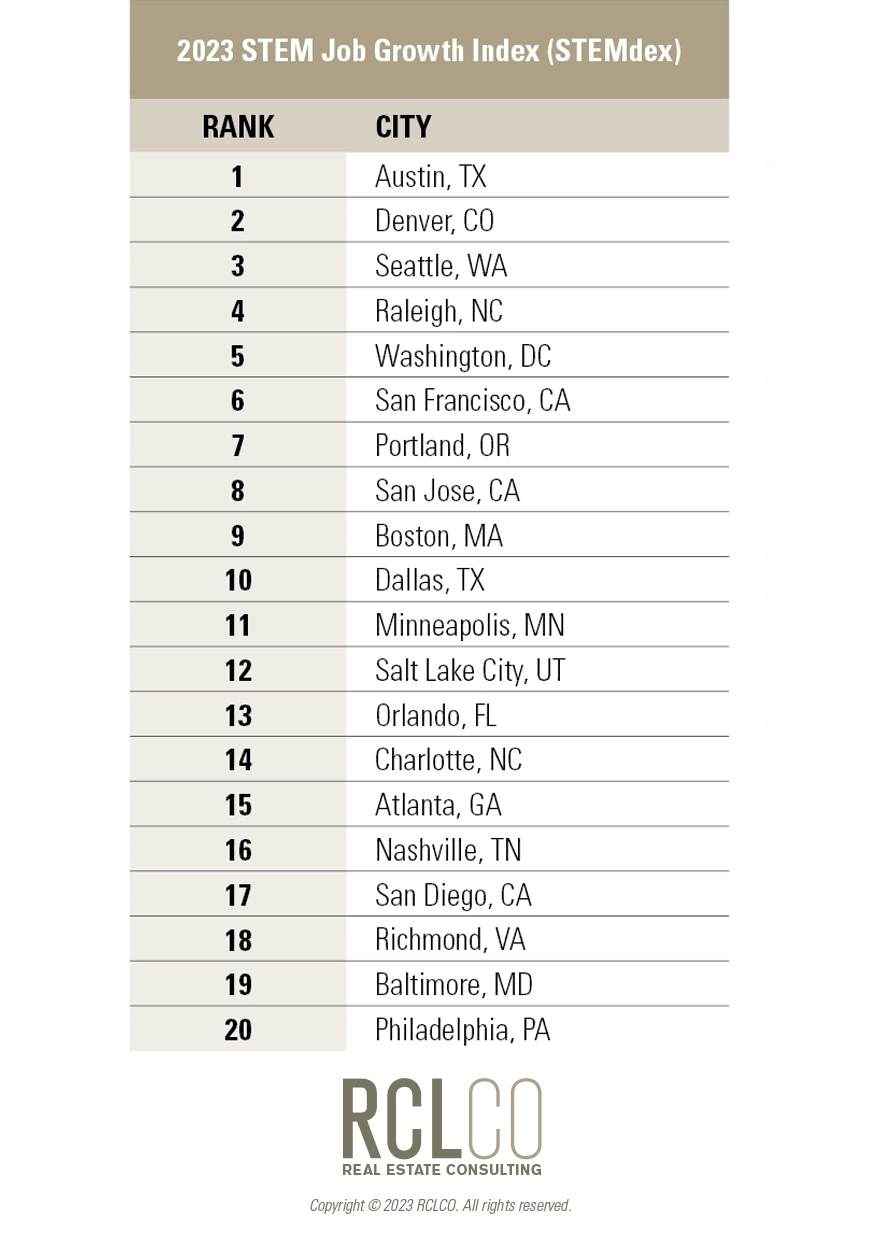
The Current STEMdex
For the fifth time in seven years Austin, Texas headlines the RCLCO STEMdex. The Texas capital ranks among the ten best cities for current economic conditions, workforce quality, and quality of life although rising office costs (both for sale and for lease) and a relatively small airport dampen the appeal marginally. A significant expansion of the airport’s terminal capacity broke ground in August of 2023. There was only one new entrant into the top 20 this year, Richmond VA, with strong quality of life and workforce characteristics.
Major Movers
The only city to exit the top 20 in the STEMdex was New York City, which fell from 13th to 21st. Declines in in-migration and the growth rate among young workers precipitated this fall. Additionally, projected future office employment growth is modest compared to the other markets studied. The high cost of living in the New York City metro, as well as a broader trend of migration into more affordable Sunbelt markets led to the drop in NYC’s relative position.
The other two major movers were Orlando and Richmond, both of which moved up five spots in the rankings. Orlando and the Central Florida region made strong gains in quality of life and business climate metrics. Firms such as Lockheed Martin, Raytheon, Cubic, Bohemia and Northrop Grumman all have a significant presence in Orlando and the city is home to the National Center for Simulation; all a part of the Orlando region’s multibillion-dollar modeling, simulation, and training industry.
Richmond made inroads in workforce quality, quality of life, and local economic conditions. Richmond is the fastest growing region in the state with much of the growth originating from relocations of residents in other parts of Virginia, in particular North Virginia(3).
The STEMdex rewards positive gains in a metro more than it punishes negative trends in others. New York City remains an economic powerhouse and the leading financial economy in the world. As the most economically influential city in the world, the MSA’s GDP would rank 10th globally if it were its own country. The high cost of living has caused declines in overall population over the last several years (-6.6%), but in particular among the 20-34 age bracket (-13.6%)(4). Access to unmatched lifestyle amenities, cultural centers, and an overall slowing of population declines year to date suggest New York’s resilience for future iterations of the STEMdex.

The key issue presently facing Austin is the tight housing market, with a housing shortage causing rising costs for residents. This is creating a wealth gap, with increases in higher earning households at the expense of households with more modest incomes for whom affordability concerns are forcing towards the suburban fridge. The unemployment rate has creeped up over the last 12 months fueled in part by layoffs at Big Tech firms such as Amazon, Alphabet, and Meta. Despite this, the city remains one of the most popular destinations for recent college graduates and the city’s numerous food and entertainment festivals keep the city attractive for all ages. The city ranked second nationally in 2022 for Major MSA GDP growth, with the local economy growing 4.3% over the last 12 months compared to a stagnant broader US macro-economy(7). Amazon, Apple, Dell and IBM remain among the largest employers in the metropolitan area.

Denver moved up two places in this year’s rankings driven by gains in quality of life metrics due to improvements in income inequality and expanding cultural amenities. That said, the city does have one of the highest rates of inflation among metropolitan areas in the US. While employment growth has cooled, that appears to be partially an issue of supply of employees as the labor participation rate is among the highest in the nation. The mile-high city still ranks near the top of the country in STEM Trends, Workforce Quality and Business Climate. The city’s sprawl does lead to significantly high commute times into the urban core job centers. Some of the largest employers in Denver include SCL Health Systems, Century Link and Wells Fargo.

Seattle is in the top five for both STEM and other economic trends and workforce quality and has been a mainstay near the top of RCLCO’s STEMdex for all of the previous six iterations. Relatively high office leasing costs and sale prices weigh down the metro but the Pacific Northwest has remained an attractive destination for recent college graduates and highly educated and skilled workers. Access to strong local colleges such as The University of Washington leads to a diverse, young and educated workforce throughout the city. In addition to representing the primary headquarters of Amazon (45,000 employees) and Tableau (2,000 employees), Seattle is home to dozens of tech startups and ventures and represents one of the most economically productive metropolitan areas in the United States.

The Raleigh-Cary Metropolitan Statistical Area represents the southeast corner of the North Carolina Research Triangle. The city is one of the fastest growing in the country, with an average of 70 people moving into the MSA each day(8). The city ranks among the strongest markets for STEM Trends, Workforce Quality, and Quality of Life metrics and features above average Business Climate fundamentals. The population includes a strong share of educated and high-earning tech-talent, many coming from some of the country’s most prominent institutions of higher learning such as UNC-Chapel Hill, NC State, and Duke University. Additionally, Raleigh has lower business operating costs and generally represents a business-friendly market. Major private employers in the market include American Airlines, Cisco Systems, and Qualcomm. Tech startups in the Research Triangle raised $3.4 billion in funding in 2022, a 16.5% increase from 2021. While the total number of deals declined, the average dollar value has seen strong increases(9).

The nation’s capital fell three spots in this year’s ranking. This decline stems from decreases in the local employment base and quality of life driven by affordable housing challenges. Wages remain near the top in the nation both for STEM and non-STEM employment and the city’s highly regarded universities, renowned public transportation network, and cultural amenities make the area attractive for in-migration.
Article and research prepared by Gregg Logan, Managing Director; Karl Pischke, Principal; and Ryan Guerdan, Senior Associate.
(1) Bureau of Labor Statistics
(2) Consortium of Social Science Associations
(3) Axios Richmond
(4) Brookings
(5) American Community Survey 2022: ACS 1-Year Estimates Detailed Tables; MSA level-population
(6) Bureau of Labor Statistics NAICS
(7) University of North Carolina Kenan-Flager Business School
(8) Triangle Business Journal
(9) PitchBook
Reasonable efforts have been made to ensure that the data contained in this Advisory reflect accurate and timely information, and the data is believed to be reliable and comprehensive. The Advisory is based on estimates, assumptions, and other information developed by RCLCO from its independent research effort and general knowledge of the industry. This Advisory contains opinions that represent our view of reasonable expectations at this particular time, but our opinions are not offered as predictions or assurances that particular events will occur.
Copyright © 2023 RCLCO. All rights reserved. RCLCO and The Best Minds in Real Estate are trademarks of Robert Charles Lesser & Co. All other company and product names may be trademarks of the respective companies with which they are associated.
Disclaimer: Reasonable efforts have been made to ensure that the data contained in this Advisory reflect accurate and timely information, and the data is believed to be reliable and comprehensive. The Advisory is based on estimates, assumptions, and other information developed by RCLCO from its independent research effort and general knowledge of the industry. This Advisory contains opinions that represent our view of reasonable expectations at this particular time, but our opinions are not offered as predictions or assurances that particular events will occur.