
November 13, 2025
Every year since 2016, RCLCO has published the STEMdex, an annual analytical ranking of U.S. metropolitan areas that evaluates their potential for future growth in Science, Technology, Engineering, and Mathematics (STEM) industries. These rankings identify markets with the strongest prospects for STEM employment and industry expansion, providing valuable insights for stakeholders across sectors.
STEM industries are vital drivers of innovation and economic growth. These jobs are among the highest-paying and most impactful, attracting a diverse, highly educated workforce. From 2019 to 2024, employment in STEM roles grew by 1.9%, outpacing the 0.9% growth in non-STEM jobs. Salaries in STEM fields averaged $112,800 annually, nearly double the $64,430 average for non-STEM roles [1]
The tech industry has undergone major structural shifts over the past year. The rapid rise of generative AI, the expansion of green technologies, and advances in manufacturing are reshaping regional economies across the country by driving changes in staffing, capital investment, and efficiencies. AI applications are now permeating nearly every sector, from data science to healthcare, creating new efficiencies and business models. At the same time, growth in renewable energy, battery storage, and carbon capture is fueling job creation in states such as Texas, Oklahoma, Colorado, and Georgia. Federal policies including the CHIPS and Science Act and the Inflation Reduction Act have further accelerated this transformation, prompting multibillion-dollar investments in domestic semiconductor and clean-tech manufacturing.
Addressing the markets that are most likely to see significant STEM growth in the coming years is important as it informs policy makers, office investors, and potential jobseekers. The concentration of these jobs has many implications on infrastructure needs, the housing market, and supply chain design.
The 2025 STEMdex serves as an update to last year’s endeavor and forecasts the concentration of STEM jobs over the next five to ten years.
Key Trends in STEM Job Growth in 2025
The most important story in tech through 2025 is generative AI and its impact on hiring, earnings, and stock market appreciation.
A significant driver of S&P 500 gains through 2024 and year-to-date in 2025 have been from a concentrated basket of mega-cap technology companies with substantial investments in generative AI such as Alphabet, Microsoft, and most prominently, Nvidia.
These impacts are being felt beyond the balance sheets of firms heavily invested in semiconductor manufacturing. J.P. Morgan reports that capital expenditures in generative AI have surpassed household consumer spending as the top driver of GDP growth through the first half of 2025. While AI Capex was only 4% of US GDP in the first half of 2025 those investments led to 92% of all growth in GDP [2]. A key question in 2026 and beyond is what ROIs will look like for these massive bets on AI technology.
Major layoffs in the tech sector and in professional services in general have been at the forefront of economic news. Firms such as Target, Amazon, Duolingo, and Salesforce have announced large scale downsizing efforts in their corporate offices, but it remains unclear how much generative AI is driving those job losses, rather than a response to changing economic conditions. Some sources are citing “AI-washing” as a means of generalizing layoffs in corporate releases when in reality the downsizing is driven by a challenging business environment or in response to over hiring in the recovery years after the COVID-19 pandemic[3].
It is still uncertain how many jobs could eventually be replaced by artificial intelligence. In the short term, some technology companies that depend heavily on internet traffic appear most at risk. Tools like Google’s AI Overview and OpenAI’s ChatGPT are beginning to change how people search for information, reducing clickthrough traffic to primary sources. Companies such as Chegg, for instance, have pointed to declining website traffic as a reason for significant layoffs in recent press releases[4].
At the same time, STEM-related jobs are spreading into industries that are not usually thought of as tech-driven. The industries with the biggest increase in STEM jobs are Professional & Scientific Services, Information, and Finance, while the industries with the greatest percentage increase include Accommodation & Food Service, Real Estate Leasing, Arts & Entertainment, and Construction[5].
While headlines continue to focus on layoffs among large technology firms, many of those cuts are outside core STEM roles. Overall, the long-term outlook for STEM employment remains strong, with new opportunities emerging across a wider range of industries.
The 2025 STEM Job Growth Index
Methodology
RCLCO analyzed 24 metrics from a range of sources, including the U.S. Census Bureau, Bureau of Labor Statistics, Oxford Economics, Numbeo, The Tax Foundation, CoStar, and the Federal Aviation Administration. These metrics are grouped into four categories and weighted based on their historical correlation with STEM employment growth:
Examines population growth, industry-specific growth, and STEM wages
Evaluates educational attainment and the concentration of millennial and Gen Z populations
Considers cost of living, walkability, and commute times
Assesses office costs and the local tax environment. While Business Climate tends to inversely correlate with current STEM job concentrations, it remains an important factor for firms and workers evaluating relocation or expansion decisions
RCLCO determined category weights by comparing historical STEMdex results with observed employment growth across major markets. The analysis found that regions with strong concentrations in certain STEM industries tend to attract additional investment. This is often due to the availability of skilled talent, established infrastructure, and desirable lifestyle amenities. As a result, factors that reflect the strength of existing STEM ecosystems and economic foundations receive greater emphasis within the model.
Other heavily weighted factors capture qualities that help attract and retain future talent, including access to higher education, housing affordability, and convenient commute options. These considerations help identify markets that are not only performing well today but are also positioned for sustainable growth.
Currently, STEM employment is most concentrated in markets such as San Jose, Washington, D.C., San Francisco, Austin, and Seattle, with Boston, Raleigh, and Denver also performing strongly. Quality of life continues to shape migration patterns, especially as hybrid and remote work allow workers to move to more affordable cities that still offer comparable amenities.
While existing job concentrations remain an important indicator, the STEMdex is ultimately focused on identifying where growth is likely to occur over the next five to ten years. By integrating emerging trends, workforce characteristics, quality of life, and business climate, the model highlights markets that appear best positioned for long-term STEM employment expansion and innovation.
The 2025 Rankings
Tampa and Jacksonville enter the Top 20

Austin Leads the Rankings

For the seventh time in nine years, Austin headlines the rankings. Over 11% of jobs in Austin are in STEM fields, nearly double the national average of concentration. Additionally, the growth in the field has been tremendous over the last five years with jobs in the field growing 3.2% annually. Austin scores highest in our Economic Factors metrics and is near the top in Workforce Quality and Quality of Life.
Other Top Performers: Boston Enters the Top Five, Dallas and Charlotte into the Top Ten

Seattle, home to tech giants like Amazon and Microsoft, anchors the Pacific Northwest as a leading center for innovation and technology. Its employment market is diverse, ranging from cloud computing and AI to gaming and e-commerce. The city’s rich ecosystem of startups benefits from access to top-tier talent and venture capital. Seattle’s focus on sustainability and green tech adds another layer of opportunity in its evolving economy, while its high quality of life continues to attract skilled workers despite rising living costs. Seattle is among the top ten metros in economic factors, workforce quality, quality of life, and business climate.

Raleigh ranks among the top metros for Quality of Life, bolstered by cultural amenities, affordability, and income equality. The market also benefits from exceptional workforce quality anchored by several major research universities. As part of North Carolina’s Research Triangle, Raleigh’s tech economy thrives in biotechnology, software development, and data analytics. Proximity to NC State University, Duke University, and UNC along with a collaborative ecosystem of startups and research institutions have positioned Raleigh as a growing hub for innovation and technology-driven employment.

Denver performs strongly across all four major categories, particularly in Economic Trends and Workforce Quality. Its tech economy has expanded steadily in recent years, with a mix of startups and established firms in aerospace, cybersecurity, and renewable energy. The city appeals to STEM professionals seeking both strong career prospects and an active lifestyle. Denver’s favorable business climate, growing infrastructure, and access to university talent continue to drive its emergence as a regional technology leader.

Despite high housing and operating costs, Boston’s economy and workforce score are among the highest nationally, reflecting its deep and resilient STEM foundation. Anchored by institutions such as MIT and Harvard, Boston remains a powerhouse in biotechnology, robotics, and artificial intelligence. The city’s employment market is rich with opportunities in research and development, supported by robust venture capital investment and strong industry-academia collaboration.
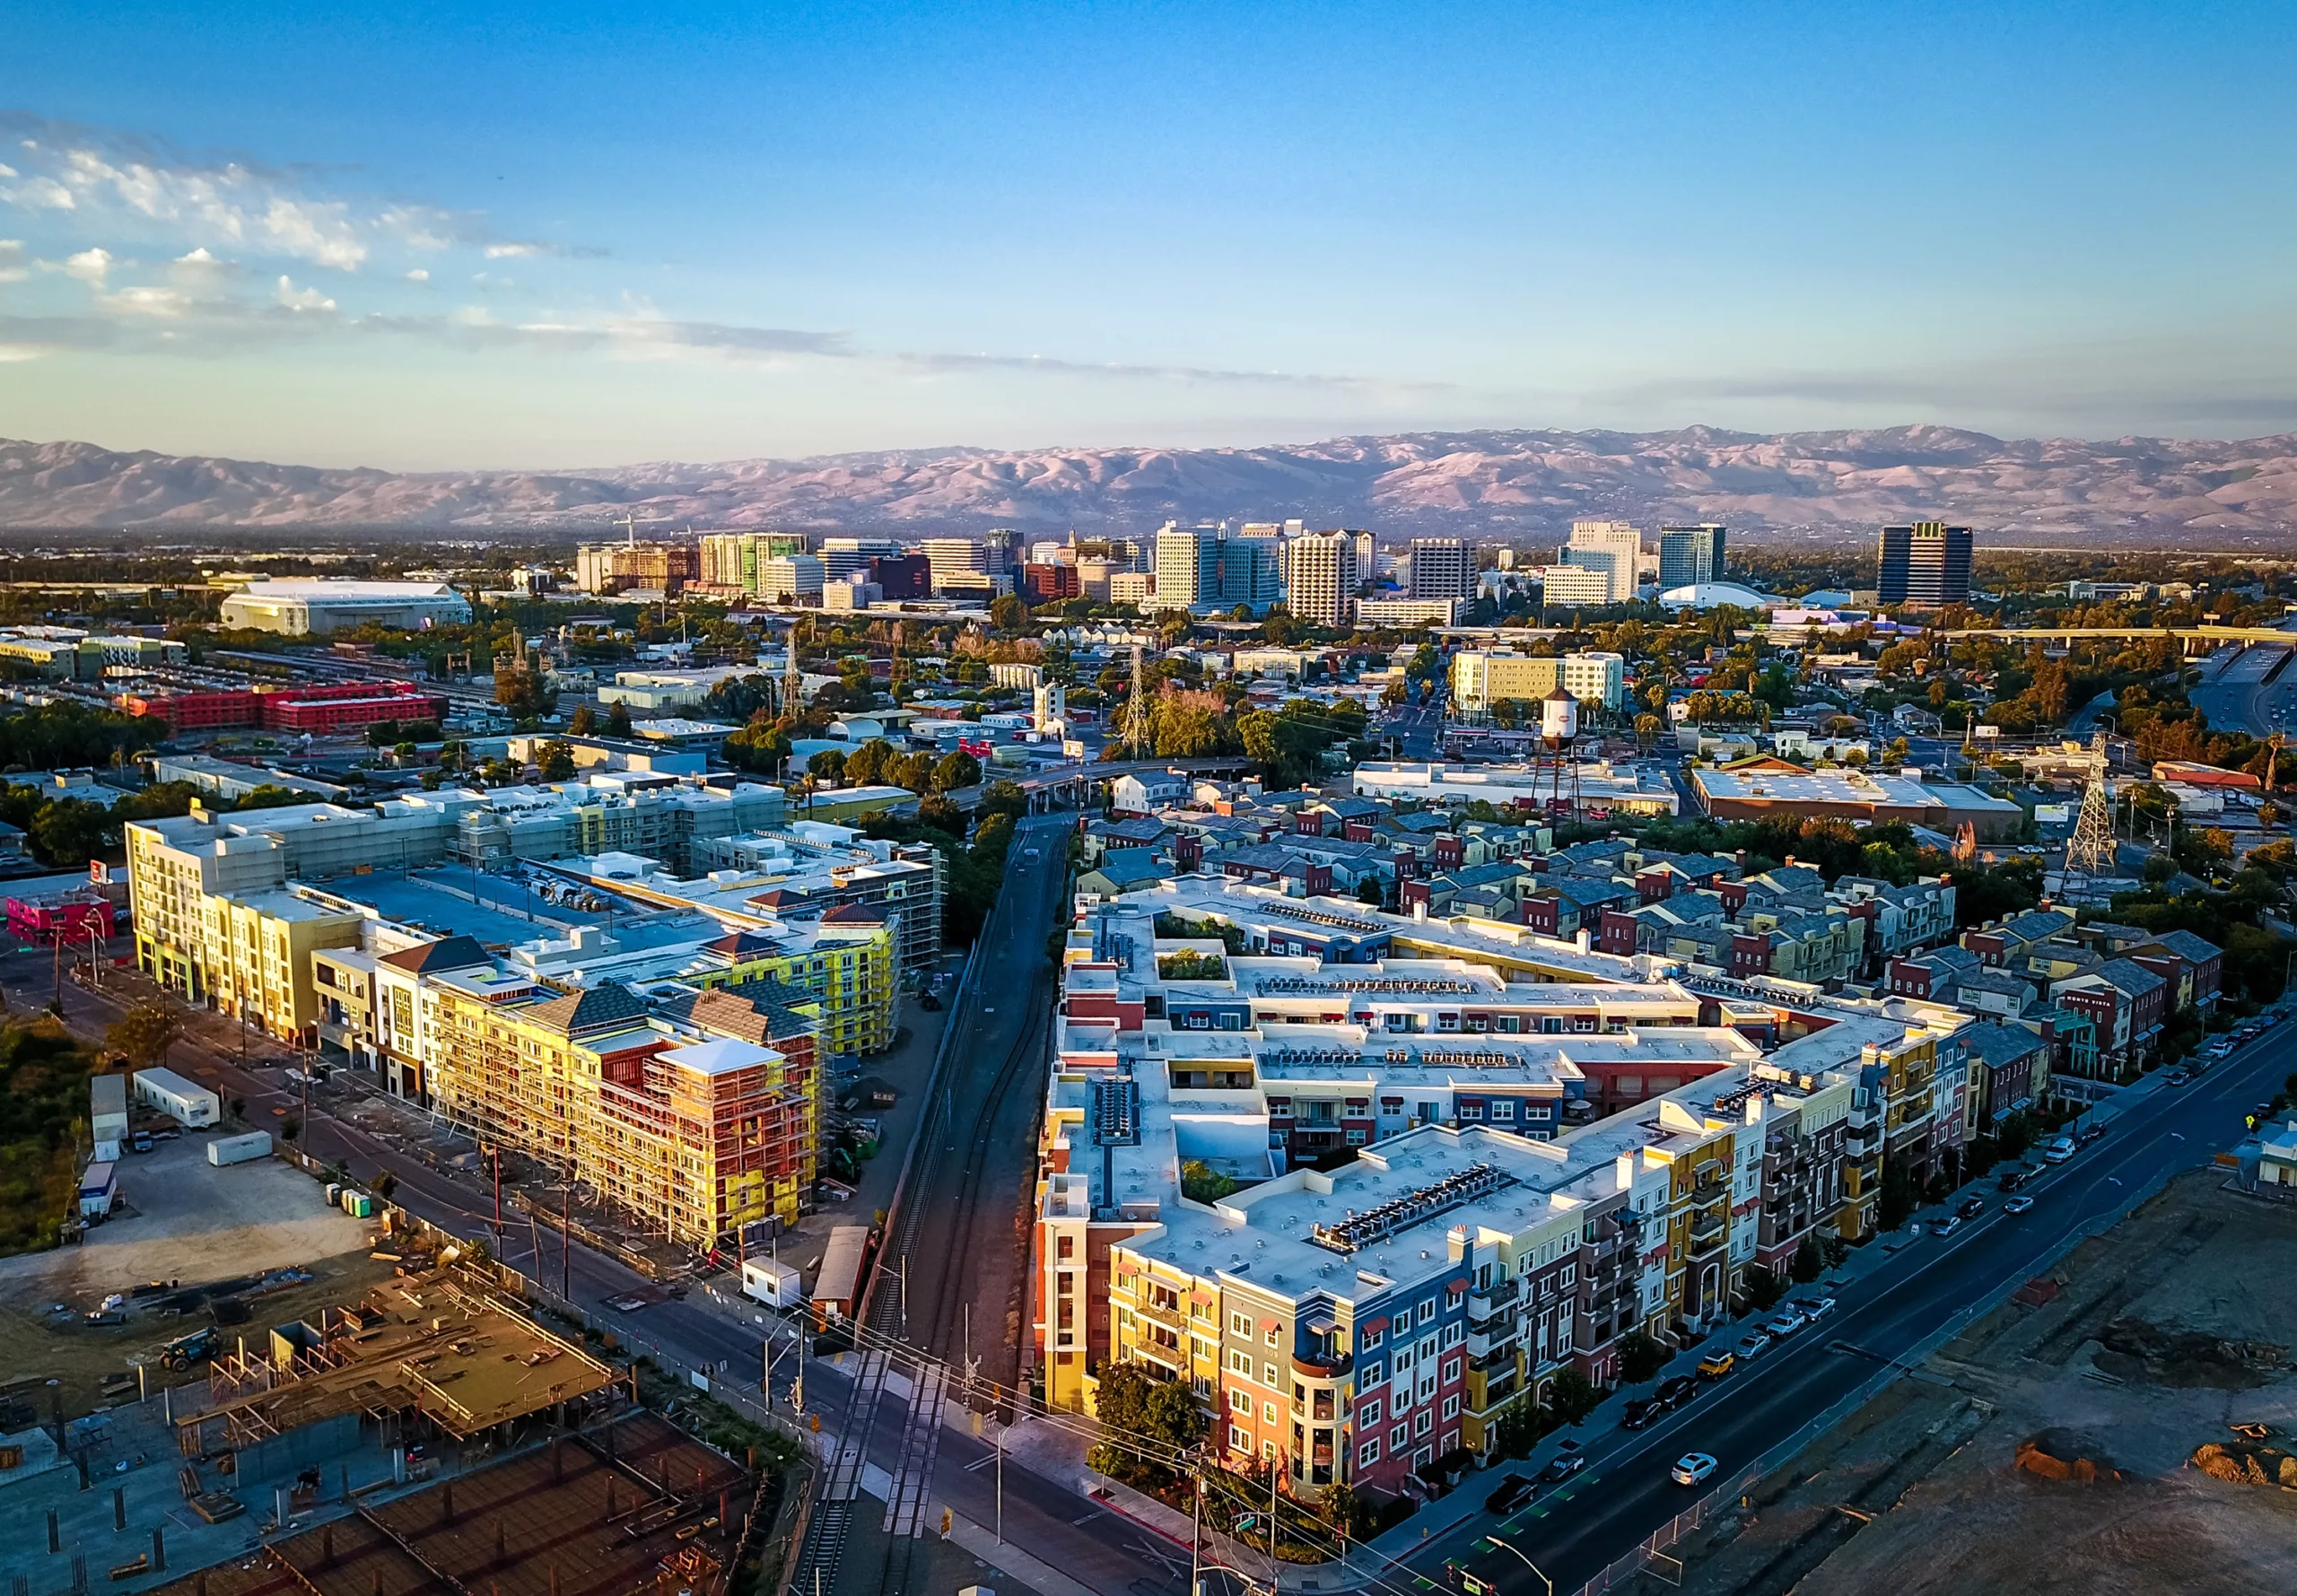
High office costs and corporate tax rates limit San Jose’s affordability, but Silicon Valley remains the global center of technological innovation. Home to Apple, Cisco, and Adobe, the region’s employment market is unmatched for software engineers, data scientists, and IT professionals. The city’s culture of entrepreneurship, access to capital, and history of innovation continue to fuel its long-term growth in STEM fields.

The nation’s capital continues to score highly in Workforce Quality and Quality of Life. Washington’s tech economy benefits from proximity to federal agencies and defense contractors, with strengths in cybersecurity, data analytics, and IT services. The city’s employment market is supported by both public and private investment, and its well-educated workforce positions it as a key player in technology related to policy and national security.

San Francisco fell four spots this year, primarily due to rising business costs and higher per capita tax burdens. Nevertheless, the area remains a top performer in Workforce Quality and Economic Factors. As a global tech hub, San Francisco’s employment base spans fintech, AI, and software development. The city’s connections to venture capital and regional proximity to leading universities like Stanford and Berkeley keep it central to the innovation economy, even as affordability challenges persist.

Dallas joins the top ten this year, propelled by strong Economic Factors, a deep and growing STEM workforce, and an increasingly business-friendly environment. The region’s economy is anchored by major employers in telecommunications, defense technology, and advanced manufacturing. Dallas is also emerging as a hub for data centers, AI development, and fintech, supported by a favorable cost of living and robust in-migration of both talent and companies. The city’s expanding university system and concentration of corporate headquarters further strengthen its position as a rising STEM economy.

Charlotte also moves into the top ten this year, driven by notable improvements in Quality of Life, relative affordability, and cultural amenities. The region’s STEM economy is increasingly diversified, extending beyond its traditional financial services base into areas like clean energy, advanced manufacturing, and information technology. With strong population growth, a collaborative business community, and growing investment in research and higher education, Charlotte is evolving into one of the Southeast’s most dynamic emerging tech markets.
Implications for Policymakers and Businesses
Employment projections can help policymakers and local leaders align education, infrastructure, and economic strategies with the future needs of their regions. Anticipating where growth will occur allows communities to prepare for emerging industries and ensure that talent pipelines and land-use plans evolve in step with economic demand.
Investments in transportation, broadband, and energy infrastructure can be guided by these projections to support expanding sectors such as logistics, clean energy, and AI. The rise of artificial intelligence is also reshaping infrastructure priorities, driving demand for data centers, high-capacity energy systems, and AI-enabled public services that enhance operational efficiency.
Targeted policies and incentives can further strengthen high-growth industries like biotechnology, renewable energy, and AI-driven innovation. By combining workforce development, tax incentives, and public-private partnerships, regions can foster competitive advantages while supporting inclusive, technology-enabled economic growth.
Article and research prepared by Ryan Guerdan, Vice President and Gregg Logan, Managing Director
[1] BLS Occupational Employment and Wage Statistics
[2] Jason Furman; Aetna Professor of the Practice of Economic Policy; Harvard Kennedy School
[3] Dr Fabian Stephany; University of Oxford
[4] Harnessing AI to Accelerate Innovation in the Biopharmaceutical Industry; ITIF
[5] Chegg Investor Relations
[6] US Census Bureau MSA Population, 2024
[7] Bureau of Labor Statistics NAICS
Reasonable efforts have been made to ensure that the data contained in this Advisory reflect accurate and timely information, and the data is believed to be reliable and comprehensive. The Advisory is based on estimates, assumptions, and other information developed by RCLCO from its independent research effort and general knowledge of the industry. This Advisory contains opinions that represent our view of reasonable expectations at this particular time, but our opinions are not offered as predictions or assurances that particular events will occur.
Copyright © 2025 RCLCO. All rights reserved. RCLCO and The Best Minds in Real Estate are trademarks of Robert Charles Lesser & Co. All other company and product names may be trademarks of the respective companies with which they are associated.
Disclaimer: Reasonable efforts have been made to ensure that the data contained in this Advisory reflect accurate and timely information, and the data is believed to be reliable and comprehensive. The Advisory is based on estimates, assumptions, and other information developed by RCLCO from its independent research effort and general knowledge of the industry. This Advisory contains opinions that represent our view of reasonable expectations at this particular time, but our opinions are not offered as predictions or assurances that particular events will occur.