November 17, 2025
By Scot Bommarito, Vice President, Research; William Maher, Director, Strategy & Research; Nolan Eyre, Research Associate; Andrew Fasano, Associate; Ethan Michalowski, Associate
Summary
Over the last decade, industrial has been a favored property type among commercial real estate investors. The secular shift to e-commerce and reshoring efforts have provided strong demand tailwinds and led to outperformance. The property type has grown from 15% of the NCREIF Property Index (NPI) in 2015 to 34% in mid-2025, with a market value of just over $300B. Annual industrial NPI returns have averaged 12.4% over the last decade, dwarfing the overall index’s 5.3% average return. In the Nareit All Equity REITs index, which is dominated by alternative property types, industrial REITs constitute almost 12% of market capitalization, trailing only retail among the traditional property types. Industrial REIT returns have also been attractive, averaging 13.5% annually over the last decade and outperforming the broader Nareit index’s 7.0% return. It has been a good decade for industrial investors.
However, tailwinds have given way to headwinds. Years of construction have led to a meaningful supply overhang which is now dragging on operating fundamentals. Recent tariff policy and trade developments threaten to slow demand for industrial real estate, particularly port logistics facilities, at least in the near term. The general backdrop of economic uncertainty also presents challenges to the sector which has been driven largely by the expansion of e-commerce in recent decades. Net absorption has fallen dramatically as demand cools, and while the supply pipeline is moderating, years of record-high deliveries have still not been fully absorbed. The result has been vacancy rates climbing to ten-year highs and rent growth slowing to ten-year lows, with both expected to deteriorate further through 2026 before gradually improving in 2027 and beyond.

Industrial Sector by Segment
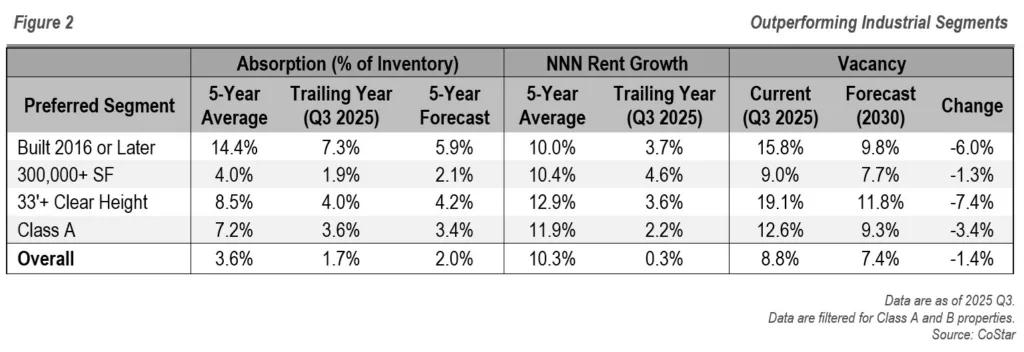
Despite the negative outlook for industrial overall, some segments of the sector are likely to fare better than others (Figure 2). The broader trend of moderation is expected to play out across segments, but some properties are likely to outperform. The characteristics that will drive relative outperformance include:
- Built since 2016
- Larger than 300K SF
- Higher clear heights (33’+)
- Class A
New construction has focused on these segments which has led to higher vacancy rates relative to the overall industrial market. However, net absorption in these segments is forecast to meaningfully outperform over the next five years. Vacancies are projected to fall at a faster rate as tenants shift to these newer, larger, high-clear properties. Stronger demand has also led to elevated rent growth over the last year. NNN rent growth forecasts are not available, but CoStar forecasts market asking rent growth to average roughly 3% over the next five years with marginal outperformance among these preferred segments . In contrast, older, smaller, low-clear facilities look likely to face the brunt of the industrial demand slowdown with weaker rent growth and stickier vacancies to follow.
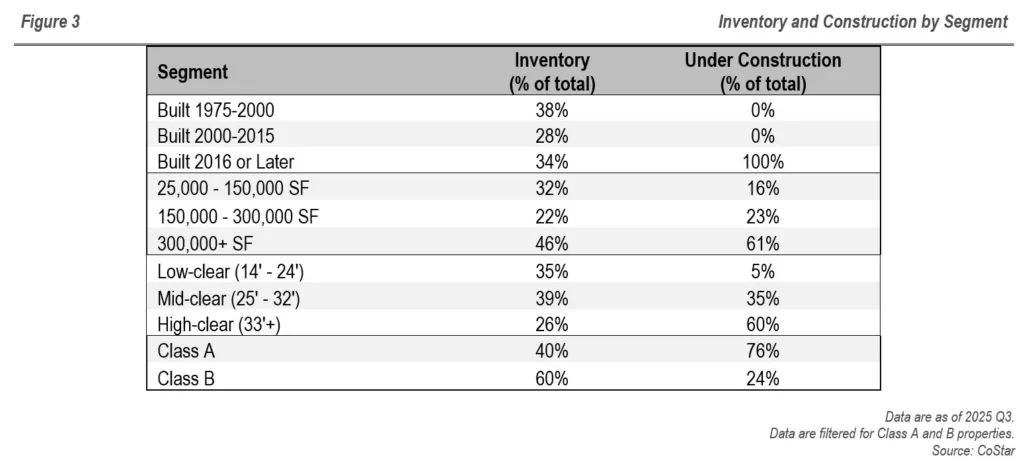
The rest of this paper analyzes industrial operating fundamentals in greater detail, segmenting the sector by age, size, clear height, and class. Figure 3 summarizes how the overall sector’s existing inventory and construction pipeline break down across these segments. All segments are filtered for Class A&B properties which are the focus of institutional investors. Most Class C properties are older, smaller, and have lower clear heights. They are excluded from the analysis to avoid biasing results downward in these segments. Even after limiting the analysis to higher quality properties, newer, larger, and higher clear height industrial properties still outperform. However, these properties’ outperformance is relative since the entire industrial sector is likely to remain challenged in the near term.
Performance by Segment
Market Fundamentals by Year Built
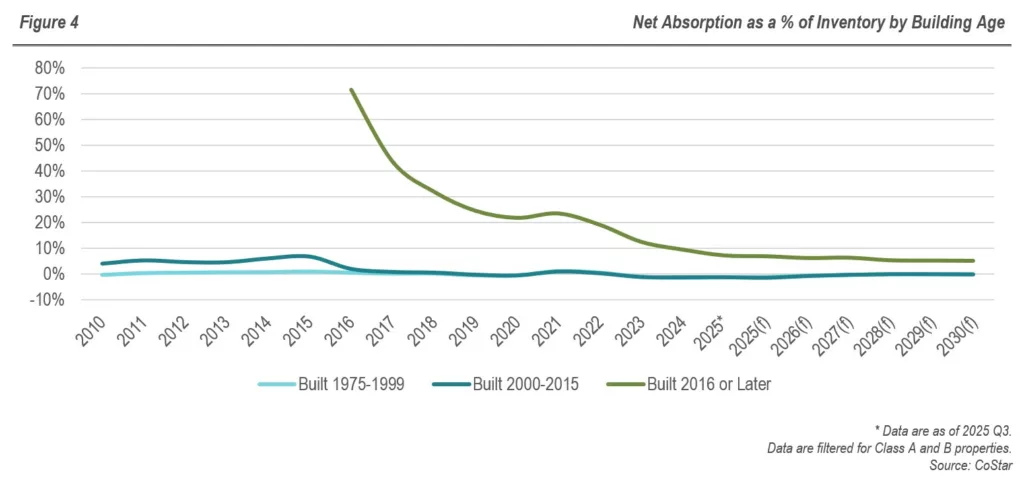
Industrial properties built in 2016 or after have exhibited stronger absorption and rent growth than older properties. As shown in Figure 4, net absorption for newer product has consistently outpaced that of older assets, reflecting sustained demand for modern logistics facilities. Absorption as a percent of inventory for properties built 2016 or after averaged 14.4% over the past five years, far exceeding that of properties built between 2000 and 2015 and those built between 1975 and 1999 (-0.4% for both). Part of that is due to a low inventory of newer product in earlier years, but even as newly built inventory increases, properties built in 2016 or later are forecast to maintain stronger absorption relative to inventory.
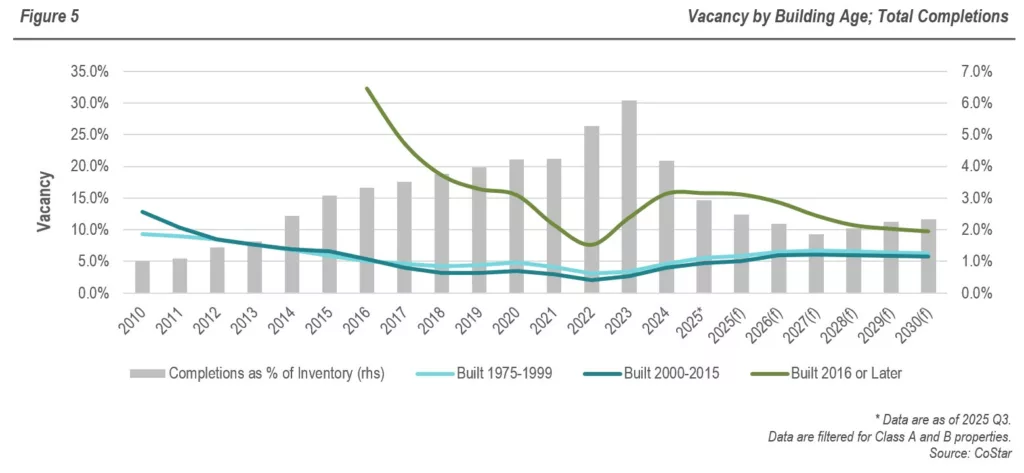
Vacancies for newer properties have historically been higher, but this is mostly due to supply increases, not weak absorption. Industrial deliveries have declined from their 2023 peak (Figure 5) and are now at their lowest levels (as a percentage of inventory) since 2016, but it will take time to absorb the recently delivered inventory. Vacancies for properties built in 2016 or after reached a trailing-year average of 15.8% in 2025 Q3, the highest level since 2019. However, rates are forecast to moderate as net absorption holds up in newly built properties which are better positioned to attract tenants given ongoing demand for modern specifications and advanced infrastructure. Vacancies are forecast to fall 6 ppts by 2030 despite remaining elevated at 9.8%. In contrast, older industrial properties have lower vacancies, but they are expected to increase over the next five years as negative absorption persists in older segments. Vacancies in properties built between 1975 and 1999 are projected to rise from 5.6% to 6.3% while those built between 2000 and 2015 will increase from 4.7% to 5.7%.
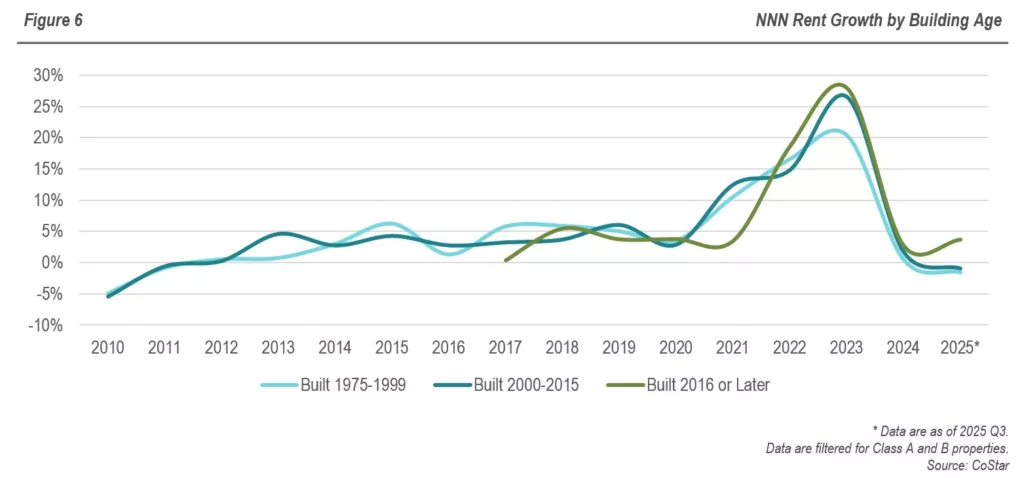
Over the last five years, NNN rent growth has been strong across industrial segments with newly built properties leading the way. More recently, rent growth has slowed dramatically as the sector faces elevated supply and diminished demand (Figure 6). Still, industrial built in 2016 or later has held up better, averaging 10.0% annual rent growth over the last five years and 3.7% growth over the last year. Rents in properties built 2000 to 2015 grew at a 5-year CAGR of 9.5% and declined 1.0% year-over-year while older properties built 1975 to 1999 recorded 5-year annual growth of 8.3% and -1.6% growth over the last year.
Market Fundamentals by Building Size
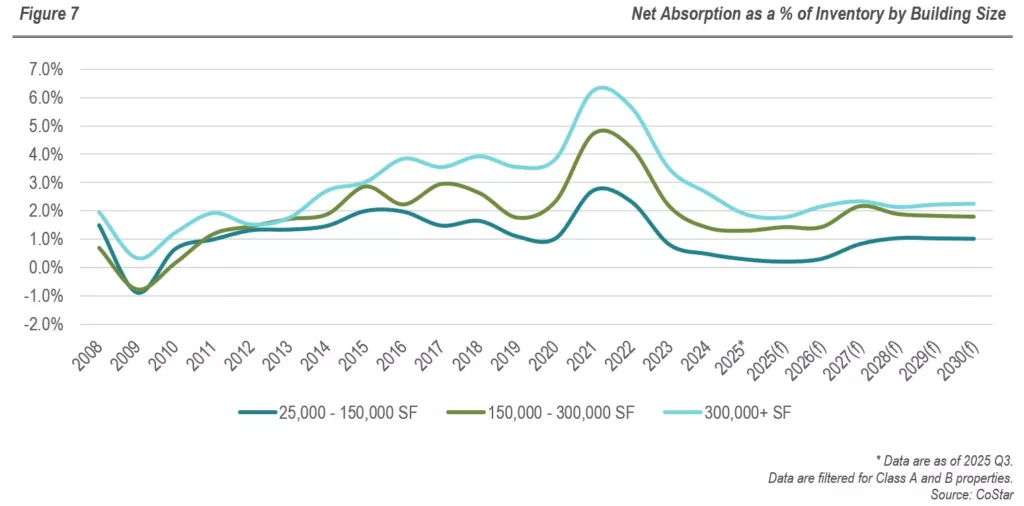
Larger industrial properties, particularly those greater than 300K SF, have enjoyed stronger fundamentals than smaller buildings. Over the past five years, 300K+ SF facilities led all size categories in net absorption relative to existing stock (Figure 7), averaging net absorption of 4.0% of existing inventory and outpacing absorption in smaller facilities of 150K-300K SF (2.8%) and 25K-150K SF (1.3%). Leasing activity has moderated across the industrial sector but has held up better in larger properties. That trend is forecast to persist with larger properties averaging annual net absorption of 2.1% of inventory through 2030. Medium and smaller properties will trail at 1.8% and 0.7%, respectively.
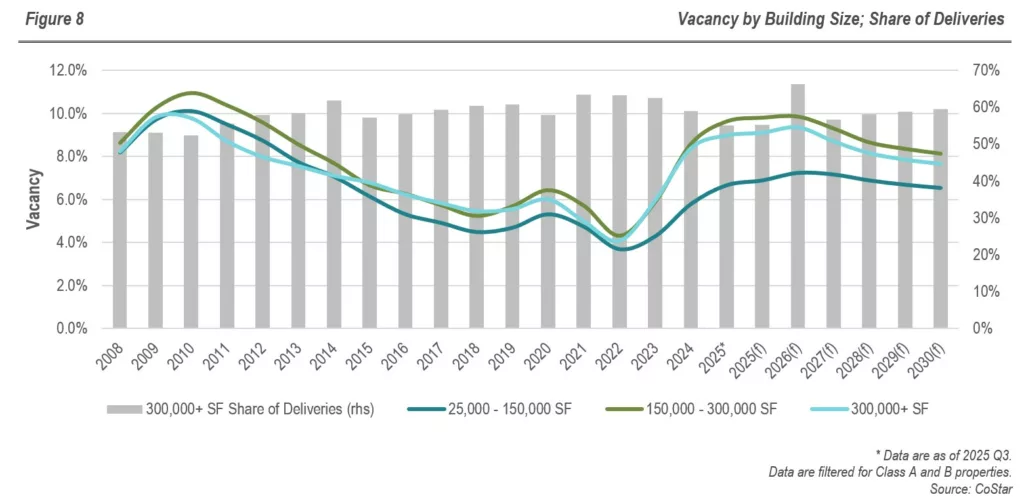
The 300K+ SF segment has experienced the most supply additions, accounting for ~60% of total deliveries over the last five years (Figure 8). This led to vacancies rising to 9.0%, well above the 25K-150K SF segment’s 6.7% but still below the mid-sized 150K-300K SF segment’s 9.6% vacancy rate. Vacancies are projected to fall meaningfully in large and medium industrial segments as their net absorption remains stronger. Vacancies for properties 150K-300K SF are expected to fall 150 bps to 8.1% while 300K+ SF properties are projected to decline 130 bps to 7.7%. Industrial buildings of 25K-150K SF are forecast to see just 10-20 bps of vacancy declines but retain the lowest vacancy rates at 6.5%.
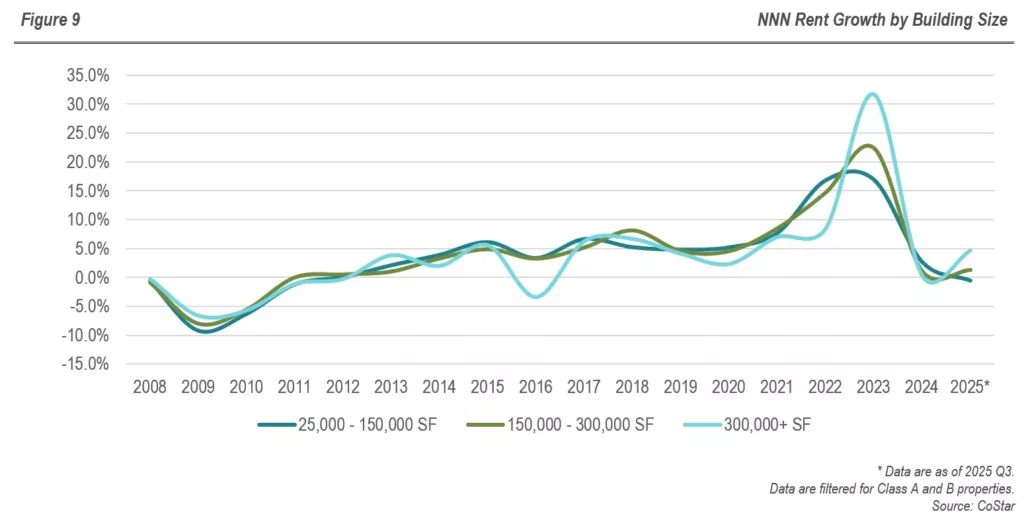
All size segments have experienced a recent slowdown in rent growth as demand cools. The 300K+ SF segment outperformed its smaller peers, posting five-year average rent growth of 10.4%, followed by the 150K-300K SF and 25K-150K SF segments at 9.6% and 8.7%, respectively (Figure 9). The performance gap has widened more recently as the largest properties recorded 4.6% annual rent growth in 2025 Q3. Rent growth was 1.3% in medium-sized properties and -0.6% in the smallest properties.
Market Fundamentals by Clear Heights
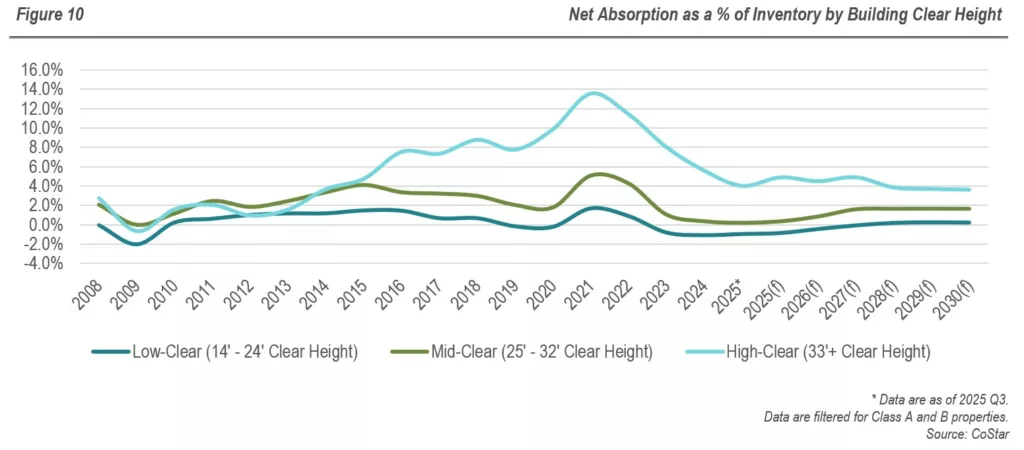
Properties with greater clear heights, a key feature of modern industrial assets, similarly outperform the broader sector. Over the past decade, properties with clear heights of 33 feet and above have demonstrated stronger demand and rent growth than low-clear (14’–24′) and mid-clear (25’–32′) facilities, despite posting higher vacancies. As a percentage of high-clear product has recorded superior net absorption, averaging 8.5% over the last five years and moderating to 4.0% over the last year (Figure 10). Mid- and low-clear assets have lagged, averaging 2.2% and -0.1% absorption, respectively, over the last five years and declining further to 0.2% and -1.0%, respectively, over the last year. High-clear assets will continue to outperform low- and mid-clear assets on net absorption, but they will remain below post-COVID levels, averaging 4.2% of inventory through 2030. Absorption as a percent of inventory for mid-clear facilities will average a modest 1.3% while net absorption for low-clear properties will remain negative at -0.1%.
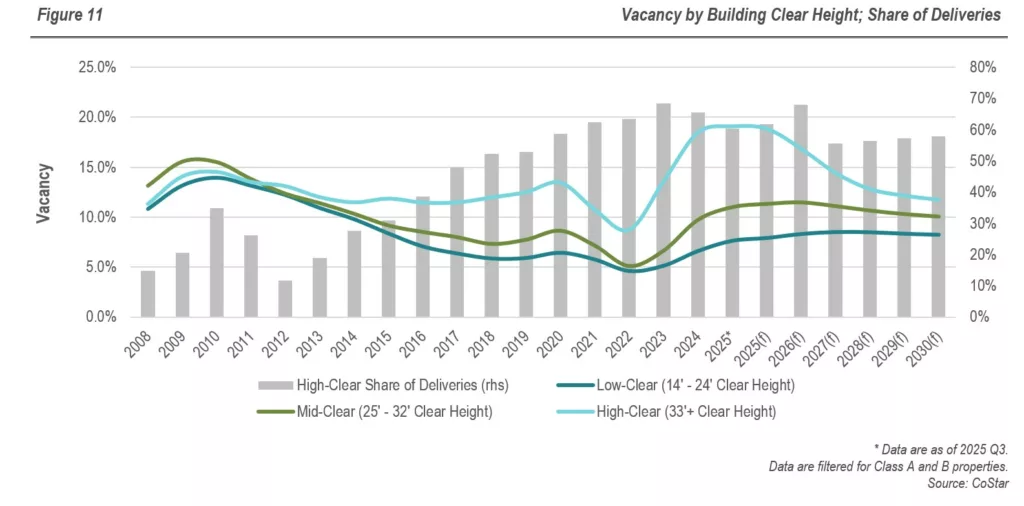
High-clear facilities have comprised nearly two thirds of industrial deliveries in recent years, driving higher vacancies in this segment (Figure 11). However, strong absorption will bring vacancies down in the coming years. Vacancies in high-clear properties are forecast to fall 7.3 ppts from 19.1% in 2025 Q3 to 11.8% by 2030. Mid-clear industrial vacancies are projected to fall by a more modest 90 bps, declining from 11.0% to 10.1% while low-clear vacancies are expected to increase from 7.6% to 8.2%, due to negative absorption in the segment.
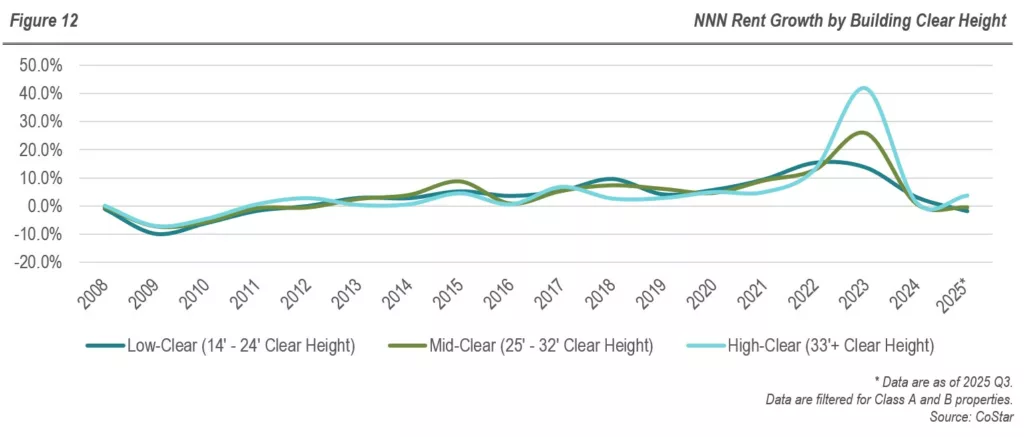
Rent growth for all three segments has slowed considerably, but high-clear facilities again outperformed. Year-over-year rent growth was 3.6% for high-clear facilities and -0.4% for mid-clear facilities as of 2025 Q3, far below their five-year averages of 12.9% and 9.7%, respectively. Annual rent growth was -1.8% for low-clear facilities, well below the other segments and its own five-year average of 8.0% (Figure 12). This trend is likely to persist in coming years.
Market Fundamentals by Building Class
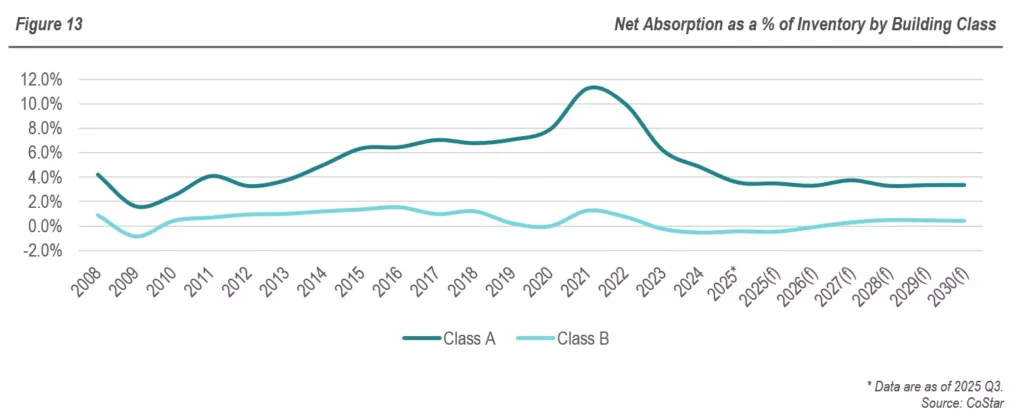
Differentiation by building class also displays tenant interest in higher-quality product. Class A assets have consistently benefited from stronger absorption than Class B properties. Class A absorption as a percent of has slowed from its five-year average of 7.2% to 3.6% in 2025 Q3 but continues to far exceed that of Class B properties, which have struggled with negative absorption since 2023, averaging 0.1% over the last five years and -0.4% over the last year (Figure 13). Absorption of Class A space is forecast to continue outpacing Class B absorption by a wide margin, averaging 3.4% of existing inventory through 2030 compared to 0.2% for Class B.
Despite much stronger absorption, vacancies have historically been higher in Class A than in Class B. Over the past five years, vacancies averaged 9.0% for Class A properties, compared to 4.0% for Class B. As of 2025 Q3, Class A and Class B vacancies rose to 12.6% and 5.1%, respectively. Vacancies are higher in Class A because a greater share of recent deliveries – approximately 90% – was for Class A product (Figure 14). Strong Class A absorption is expected to bring down vacancies, which are projected to fall 3.3 ppts to 9.3% by 2030. In contrast, flat absorption in Class B properties will lead to modest vacancy increases, rising 60 bps to 5.7%.
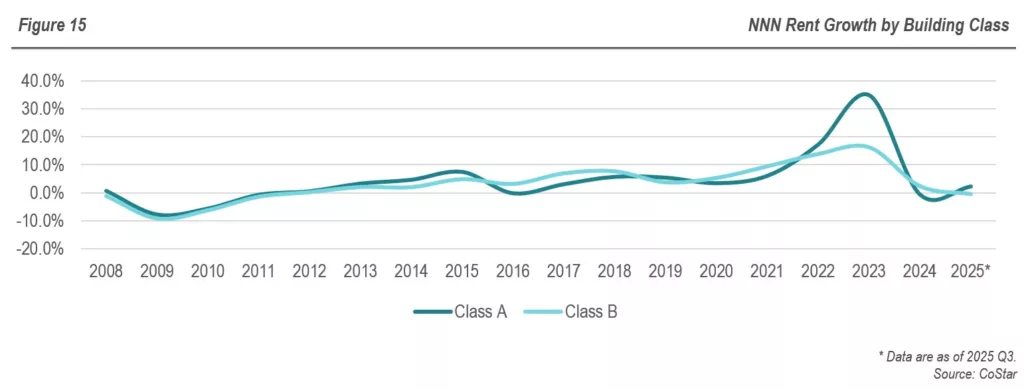
Sustained demand for Class A space has translated into stronger rent performance. While both classes experienced similar patterns of growth and correction, Class A rent growth has averaged 11.9% over the past five years, exceeding Class B average growth of 8.3% (Figure 15). However, due to slower absorption, rent growth for the two segments has slowed considerably and was 2.2% for Class A properties and -0.4% for Class B year-over-year as of 2025 Q3. Going forward, rents will likely continue to grow at a faster clip in Class A properties.

Conclusions & Implications
In the near to mid-term, the industrial sector will continue to face significant headwinds as it grapples with a supply overhang and the economic uncertainty around tariffs and trade policy. Fundamentals have weakened substantially and are expected to remain soft, with weak absorption driving slower rent growth and higher vacancies. Performance differentiation within the sector will persist as tenant needs evolve. Stronger tenant demand for newer, high-quality facilities with high clear heights and large floorplans will help these segments to hold up better than the overall sector. However, even these properties are expected to face slower rent growth and leasing relative to recent highs. Older, smaller, lower-quality product will underperform, bearing the brunt of the industrial sector’s demand slowdown.
Industrial’s long-term outlook is more favorable, supported by durable secular trends, including the continued expansion of e-commerce, reshoring and onshoring initiatives, and the reorganization of supply chains. Still, it will take time for these trends to offset near-term weakness, and the glory days of industrial returns are likely to remain in the rear-view mirror for a while.
Disclaimer: RFA is a SEC registered investment advisor, collectively hereinafter (“RFA”). The information provided by RFA (or any portion thereof) may not be copied or distributed without RFA’s prior written approval. All statements are current as of the date written and does not constitute an offer or solicitation to any person in any jurisdiction in which such offer or solicitation is not authorized or to any person to whom it would be unlawful to make such an offer or solicitation.