Disruptive Demographics: Housing Production & Demographic Reality Are Moving in Different Directions

Below, we identify some of the ways in which the demographics of new households are moving in one direction, while housing production is sometimes moving in the opposite direction. We also include specific suggestions for how housing and community developers might better adapt to these changing circumstances to better serve a broader and potentially larger new for-sale housing market audience:
- There is a growing mismatch between the demographics of new households, the stated housing preferences of households active in the for-sale housing market, and the new home products and price points being offered to the market.
- Decreasing new home affordability is part of a long-term trend predating the current affordability crisis. The mix of sizes of the new home inventory is driving up home prices in addition to higher mortgage, labor, and land costs. Compared to the years leading up the Great Recession, the share of newly constructed homes larger than 3,000 square feet increased from 19% to 30%.
- Baby boomers already have the purchasing power that millennials are still creating, and they remain an important market for new-home sales.
- More millennials are now entering the market, creating potential demographic tailwinds for the for-sale housing market, but it will be difficult to fully take advantage of this trend if new housing and community developers are unable to more closely match new home products and prices to demand.
- New household growth is both younger and increasingly diverse, and this has a major impact on purchasing power at the same time that prices are peaking and inventories of more attainably priced housing are declining.
- There is a larger market for medium-density attached and smaller detached new homes than is currently being offered, and these and other creative solutions will become increasingly important as the U.S. population further diversifies. Otherwise, the size of the overall new for-sale housing market could decline.
Nine years into the recovery following the Great Recession of the late 2000s, the number of home sales has yet to fully recover to pre-recession highs.1 Over the same time period, there was a rapid expansion of the rental housing market as the large millennial generation entered young adulthood and prime lifestage for rental housing (20s and early 30s). From 2005 until 2016, growth in renter households outpaced growth in owner households. However, that trend is now reversing. More millennials are now entering the traditional home ownership stages of their lives (mid-30s to mid-40s), creating potential demographic tailwinds for the for-sale housing market. However it will be difficult to fully take advantage of these potential tailwinds if new housing and community developers are unable to match new home products and prices to demand.
Figure 1: Median Home Price and Median Household Income (1975=100)
Source: US Census Bureau
The issue that has received the most attention relative to the challenge of meeting new for-sale housing demand is the affordability crisis, as home prices have increased faster than household incomes, due to rising construction costs, labor shortages, and high land costs. The share of new homes priced below $300,000 has dropped from over 55% to just over 40% in just the past five years. However, decreasing new home affordability is part of a long-term trend predating the current crisis, indicating other factors are contributing. Home prices are up, not only because costs are higher, but also because new homes are, on average, bigger, and have been trending in that direction for a long time. There is a growing mismatch between the demographics of new households, the stated housing preferences of households active in the housing market, and the products and price points being offered to the market.
Figure 2: Share of New Home Sales by Price Band
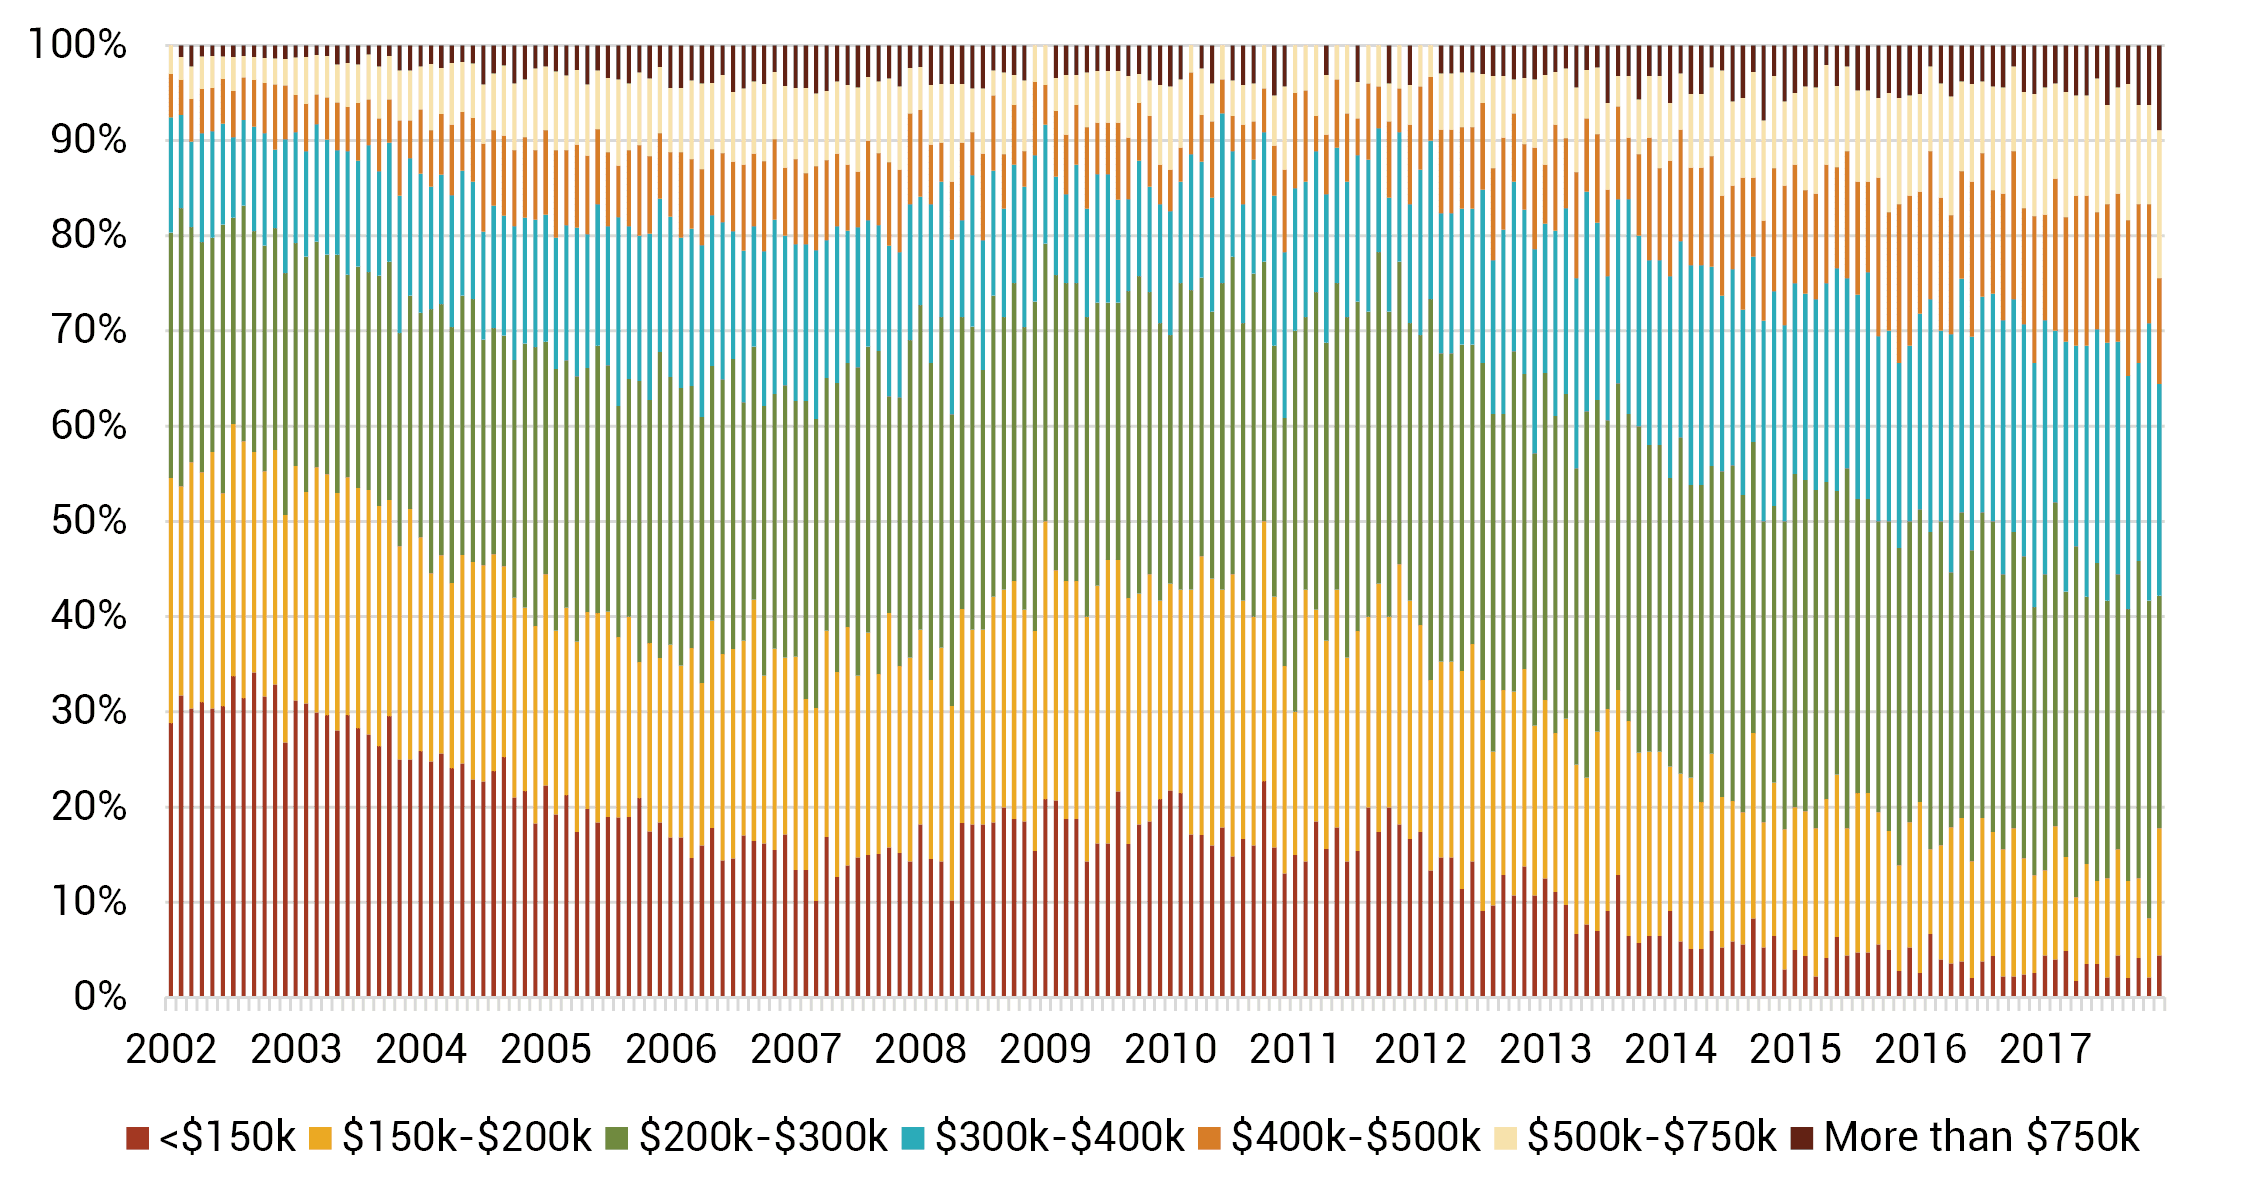
Source: US Census Bureau
Smaller Households and Bigger New Homes
The mix of sizes of the new home inventory is driving up home prices in addition to increasing labor and land costs. While the average household size continues to decline, and families with children represent only about a third of new home purchases, home sizes are trending larger. This is one of the best (or worst) examples of long-term demographic trends and trends in new home production moving in opposite directions. During the housing recovery (2010 to 2017) the average new home size increased over 300 square feet, adding about $40,000 to the average new home price. Compared to the years leading up the Great Recession, the share of newly constructed homes smaller than 1,400 square feet decreased from a pre-recession high of 13% to only about 7% today, while the share of newly constructed homes 3,000 square feet and larger increased from 19% to 30%. Meanwhile RCLCO’s consumer research indicates there is substantially more demand for smaller single-family homes and townhomes. One of the ways that a degree of more attainably priced housing products is being successfully marketed includes offering higher-density for-sale housing, which we addressed in our February 28, 2019, Advisory.
Figure 3: Share of New For-Sale Homes by Size
Source: US Census Bureau, RCLCO
Household Growth Is More Diverse
New household growth is both younger and increasingly diverse, and this has an impact on purchasing power at the same time that prices are peaking and inventories of more attainably priced housing are declining. Black, Hispanic, Asian, and other minority households have lower homeownership rates than white households. White households typically have higher incomes and greater equity and have accounted for a much higher share of household growth in the past, and thus have historically driven new housing demand. While builders and community developers continue to target new housing product to older consumers with greater equity, growing the ranks of new homeowners requires reaching these more diverse groups with lower homeownership rates, including younger households overall—particularly those in the 35 to 44 age range.
Figure 4: Homeownership Rate by Age Group and Year
Source: US Census Bureau
The higher homeownership propensity of existing mature homeowners encourages builders and community developers to target these customers as they are more likely to leverage their current home values towards the purchase of another home, and are often less financially constrained. While much of the focus is on millennials, who due to their sheer numbers are the most important long-term component of household growth and future housing demand, baby boomers already have the purchasing power that millennials are still creating, making boomers an important market for current new home sales. This is the main reason that community developers and homebuilders have continued targeting the older baby boomer generation as they reach retirement and the age of downsizing, for both suburban and urban infill neighborhoods and active adult communities (AACs). In fact, according to the Census Bureau, the number of new single-family homes being built in age-restricted developments increased from about 11,000 units in 2010 at the start of the recovery, to about 26,000 units in 2017. RCLCO’s annual survey of the Top-Selling Master-Planned Communities indicates that many of the top communities derive a large share of their home sales from age-restricted product.
Increase in ‘Non-Traditional’ Households
According to the Joint Center on Housing Studies at Harvard University (JCHS), single households and married households without children are expected to account for 69% of household growth from 2018-2028. Growth in these household types are largely driven by the projected growth in older-adult households. The number of married households with children is also expected to increase, primarily driven by millennials. However, compared with previous generations, millennials are having fewer children,2 which along with the increase in older households is driving average household size downward at a time when the size of new homes is trending upward.
Figure 5: Historic Persons per Household and Household Size, 1960-2017
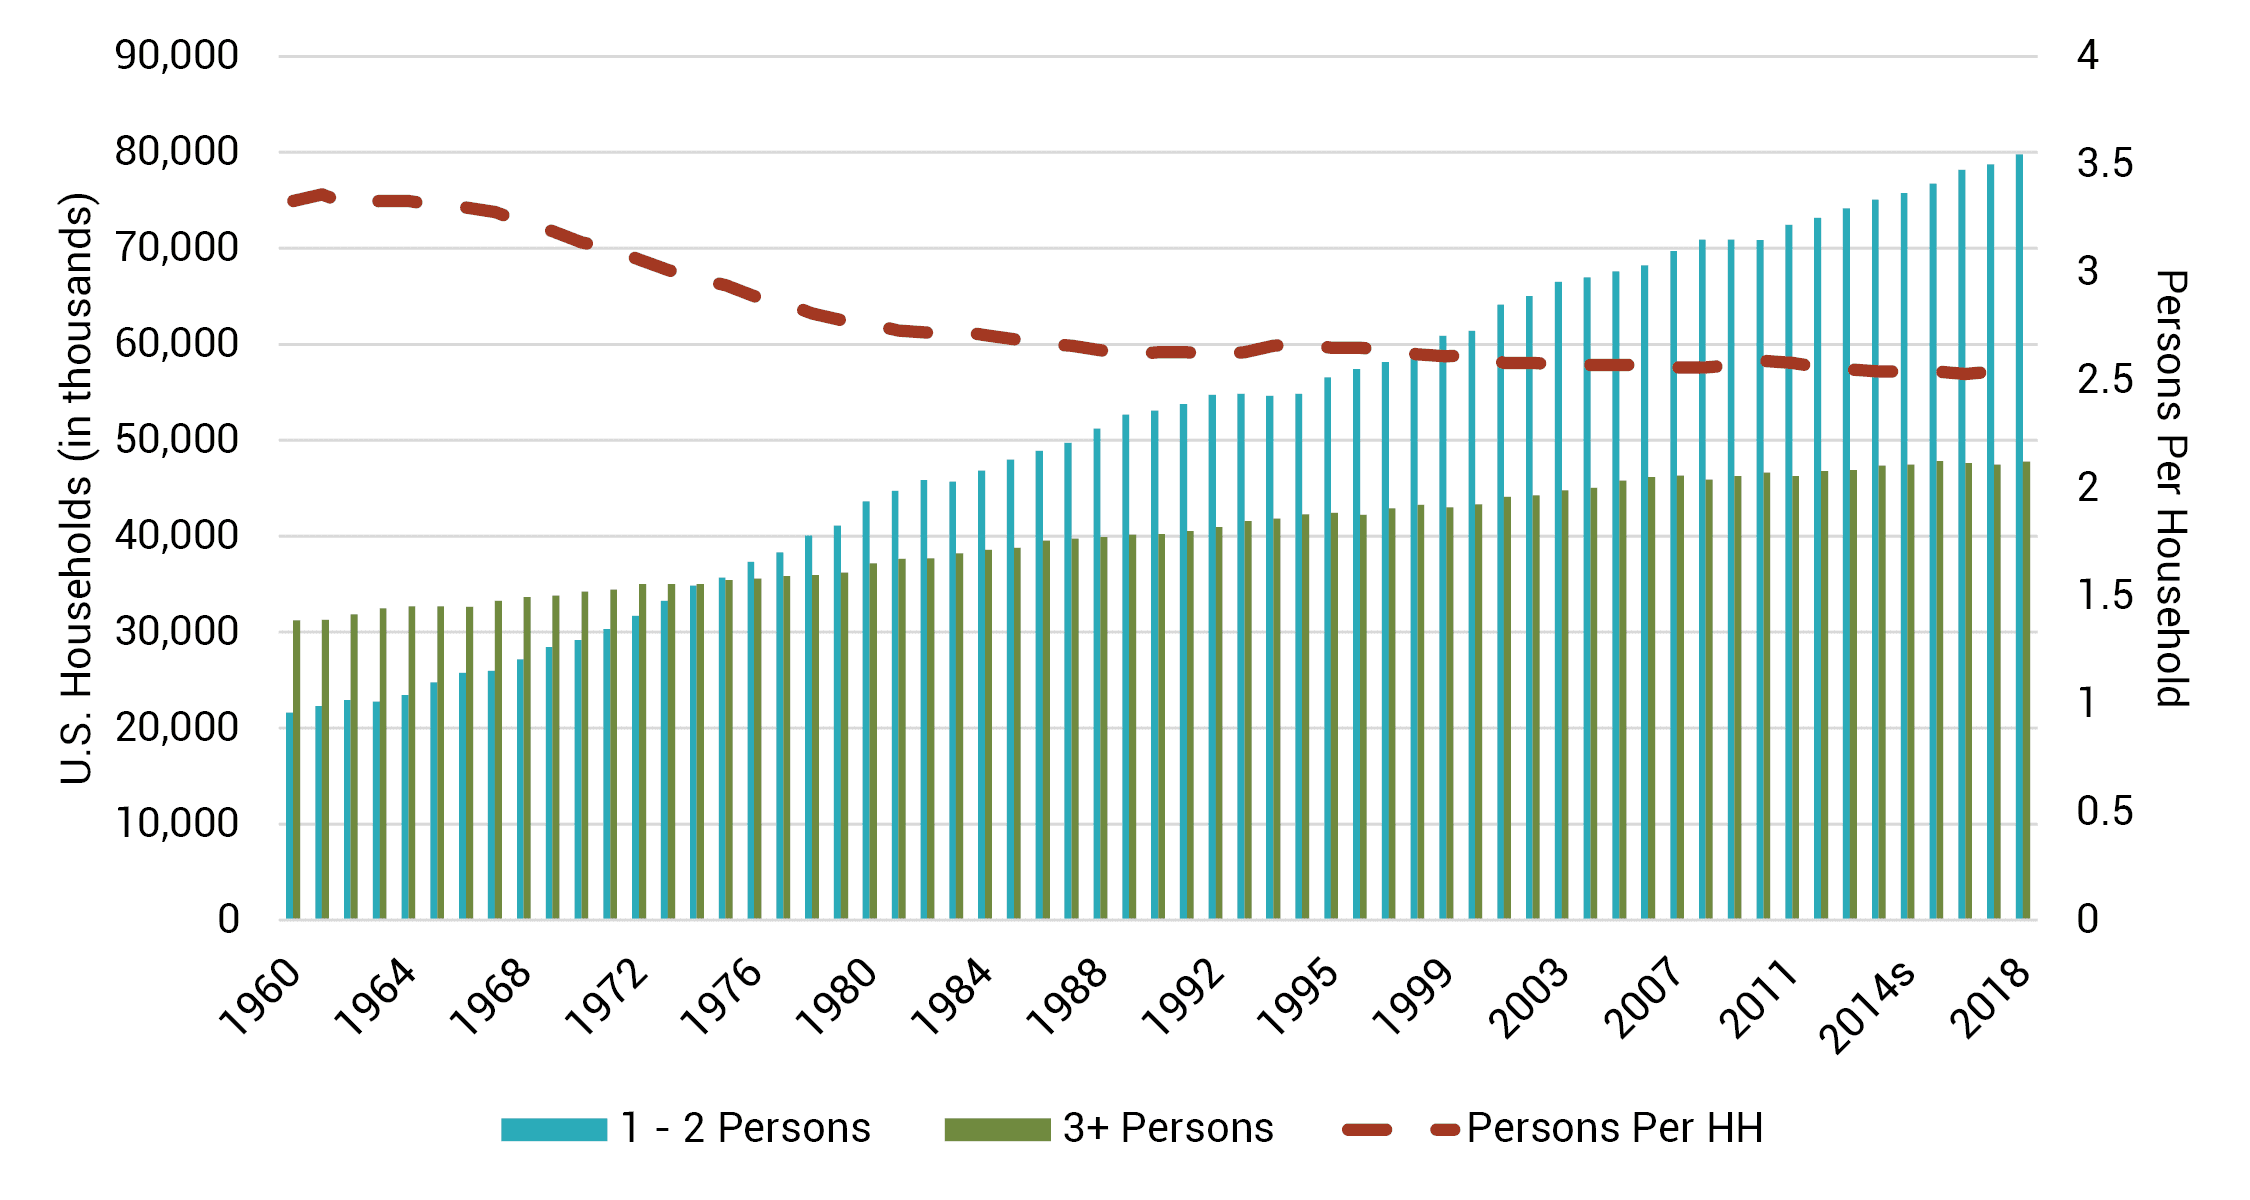
Source: RCLCO
Diversity of New Household Growth Impacts Homeownership Rate
While the total homeownership rate declined both during the Great Recession and in the years following, starting in 2016 the homeownership rate started to recover and stood at 64.8% in Q4 2018.3 However, the decline and the subsequent slight recovery in homeownership have not been the same across all demographic groups. While all age groups were impacted by the recession, the drop in homeownership rates between 2010 and 2017 were most severe among younger households. The U.S. Census Bureau predicts that homeownership rates will continue to increase among all age groups between now and 2021. However, the increase in the homeownership rate is expected to be smallest in the younger age groups.
The share of first-time buyers among all homebuyers has been lower post-recession, at about 33% in 2018, down from 34% in 2017, and below the historical average of around 40%.4 Despite the economic stability following the Great Recession, the share of first-time buyers is still below long-term trends, largely due to affordability in terms of both price and access to credit.
The biggest demographic influence on housing demand is of course household growth. The Census Bureau recently revised downward its population projections, predicting somewhat slower rates than previously forecast due to reduced levels of foreign immigration and slightly higher mortality rates for some population segments. Using the updated Census figures, JCHS is forecasting household growth of 12.2 million from 2018 to 2028, and 9.6 million from 2028 to 2038—reductions of 10% and 13% from previous projections. Lower immigration accounts for most of the difference, impacting previous expectations of the growth in Hispanic and Asian populations. Increasingly stringent federal policies towards immigration could further decrease actual growth. Meanwhile, aging boomers will drive growth of age 65 and over households, while millennials will drive growth of 35 to 44 year old households. The population aged 45 to 64 will decline, due to the aging of the boomers and the smaller Gen-X population that follows them.
Figure 6: Projected Household Growth by Age and Race/Ethnicity 2018-2028
Note: White, Black, and Asian/other shows only non-Hispanic members. Hispanics can be of any race.
Source: JCHS Tabulations of US Census Bureau and 2018 JCHS Household Projections
As shown on the chart above, the JCHS projections anticipate a diverse mix of household growth by race and ethnicity from 2018 to 2028. The number of Hispanic households is expected to account for 37% of the total growth, Asian (and other non-Hispanic minority) households 24%, and non-Hispanic black households 16%. This is significant, given that 83% of homebuyers (new and resale) in 2018 were white, and minority homeownership rates are below those of white households. Given the largely minority household growth and their lower homeownership propensity, the same unit of household growth may not result in the same level of home sales activity as in the past.5
Racial and ethnic minorities are a larger share of first-time buyers than they are of move-up buyers.6 Despite minority households having lower homeownership rates than white households, their desire for home ownership is similar,7 and represents a growth opportunity when solutions are found to increase the supply of attainably priced housing, which consumer research indicates can be met at least in part through higher-density development.
Meanwhile the U.S. population continues to grow in diversity, with the white share of the population declining to about half of the total over the next 25 years.
Figure 7: Population by Race and Hispanic Origin in the United States
*Non-Hispanic members of race; Hispanics can be of any race.
Source: US Census Bureau, Brookings Institute, RCLCO
Applying current 2018 homeownership rates by racial/ethnic group compiled by the U.S. Census Bureau to the projected future racial and ethnic composition of U.S. household growth indicates that the homeownership propensity of new households in the future may be significantly lower than the current homeownership rate. As such, if current trends hold, it is likely that the overall U.S. homeownership rate will decline.
Figure 8: Homeownership Rate to Forecasted Homeownership Propensity of Household Growth 2018-2028 and 2028-2038
Source: US Census Bureau, 2018 JCHS Household Projections, RCLCO
The change in homeownership rates has been mixed, with moderate growth in Hispanic and Asian homeownership rates, and a significant decline among black households following the Great Recession.8 Whether or not these homeownership propensities increase will depend on what happens with incomes (which have been fairly flat), housing affordability, and access to credit, which are key factors in the divide between white and minority homeownership rates. Incomes are lower for minority households on average than for white households, with the exception of non-Hispanic Asians,9 and studies indicate minority households are more likely to carry higher student debt.10 Minority households also tend to have less access to credit and have lower credit scores on average than white households, making obtaining a mortgage or other financing more difficult.11 From a housing policy perspective, addressing these structural issues will be important to bridging the homeownership gap.
Broadening the Mix of Products and Pricing
Currently, the mix of new for-sale product types is not significantly different than it was in 2000, with a few more townhomes being built, and fewer condominiums. However, RCLCO’s recent Housing and Community Preference Survey found that even though the conventional single-family detached home remains the most desirable for-sale residential product type, approximately a third of all consumers surveyed would consider a higher-density attached product, yet these product types only make up 14.8% on newly constructed homes. On average, these product types are offered at more attainable price points than single-family detached homes and often appeal to buyers wanting to own a home but unable to afford detached product.
Figure 9: Share of New For-Sale Housing Construction and Consumer Preferences by Type
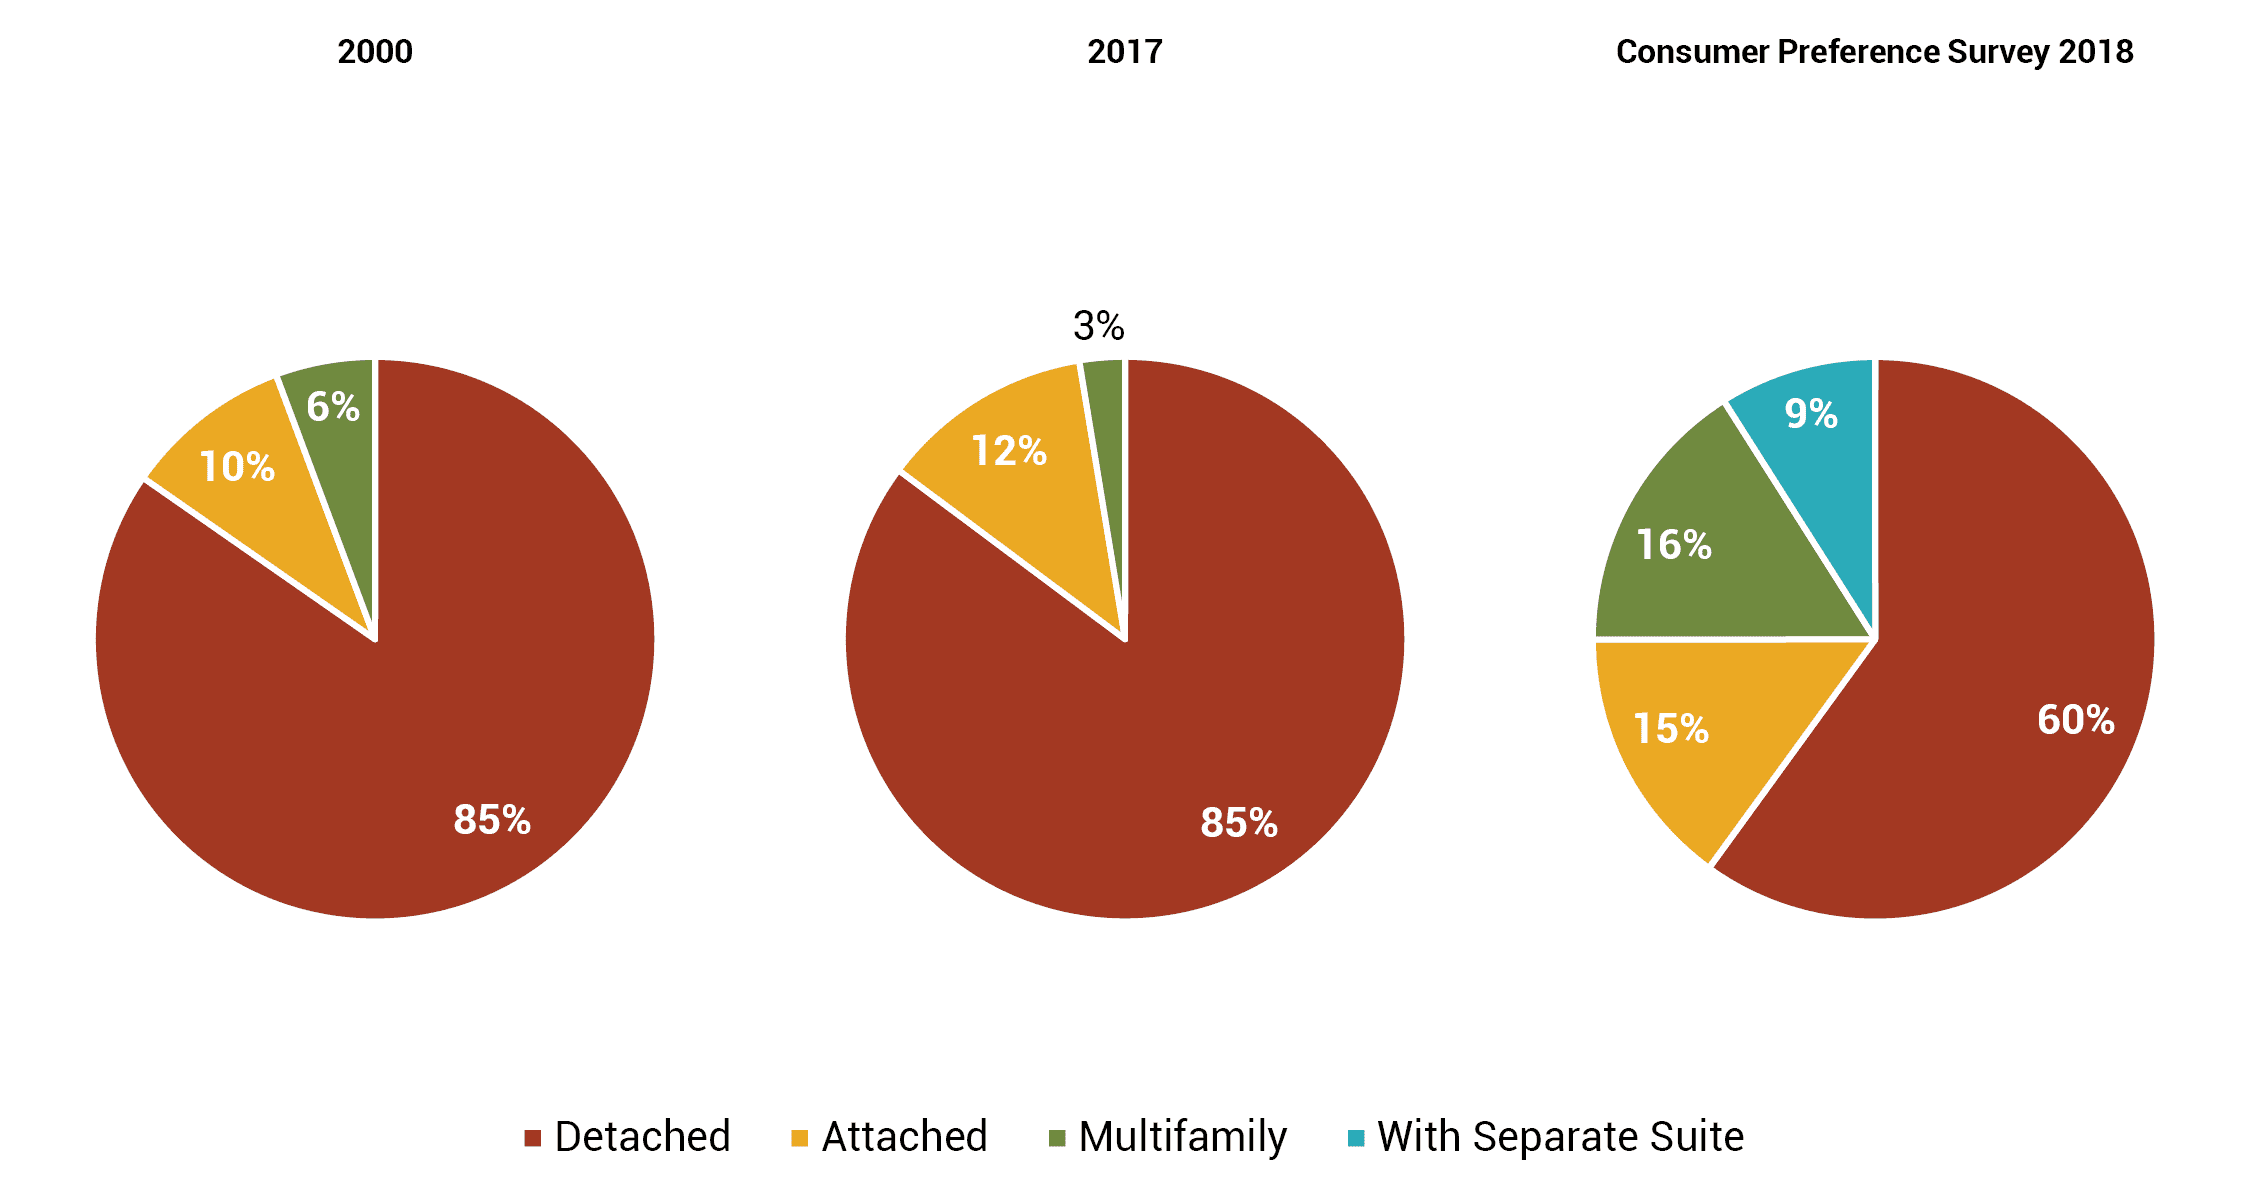
Source: US Census Bureau, RCLCO Consumer Research
In addition, RCLCO’s consumer survey suggests a larger market for smaller detached new homes than is currently being offered, which represents further opportunity assuming such units can be profitably built and marketed. About 18% of individuals surveyed indicated they would purchase a home smaller than 1,500 square feet, significantly more than the share of housing at that size being built today. Considering these and other creative solutions will become increasingly important as the U.S. population further diversifies, or the size of the overall new for-sale U.S. housing market could decline.
Article and research prepared by Gregg Logan, Managing Director, and Rachel Waldman, Associate.
References
- Houses Sold by Region, US Census Bureau
- Vital Statistics Rapid Release, Center for Disease Control
- Homeownership Rate for the United States, Federal Reserve
- 2018 Profile of Home Buyers and Sellers, National Association of Realtors
- See above
- Characteristics of Recent Home Buyers, National Association of Home Builders
- Own-Rent Analysis, Fannie Mae
- Quarterly Homeownership Rates by Race and Ethnicity of Householder, US Census Bureau
- Homeownership by Race and Ethnicity, National Association of Home Builders
- New Analysis Reinforces Racial Disparities of Student Loan Debt, Higher Education Today
- Credit Scores Perpetuate Racial Disparates Even in America’s Most Prosperous Cities, Urban Institute
Disclaimer: Reasonable efforts have been made to ensure that the data contained in this Advisory reflect accurate and timely information, and the data is believed to be reliable and comprehensive. The Advisory is based on estimates, assumptions, and other information developed by RCLCO from its independent research effort and general knowledge of the industry. This Advisory contains opinions that represent our view of reasonable expectations at this particular time, but our opinions are not offered as predictions or assurances that particular events will occur.
Related Articles


Speak to One of Our Real Estate Advisors Today
We take a strategic, data-driven approach to solving your real estate problems.
Contact Us