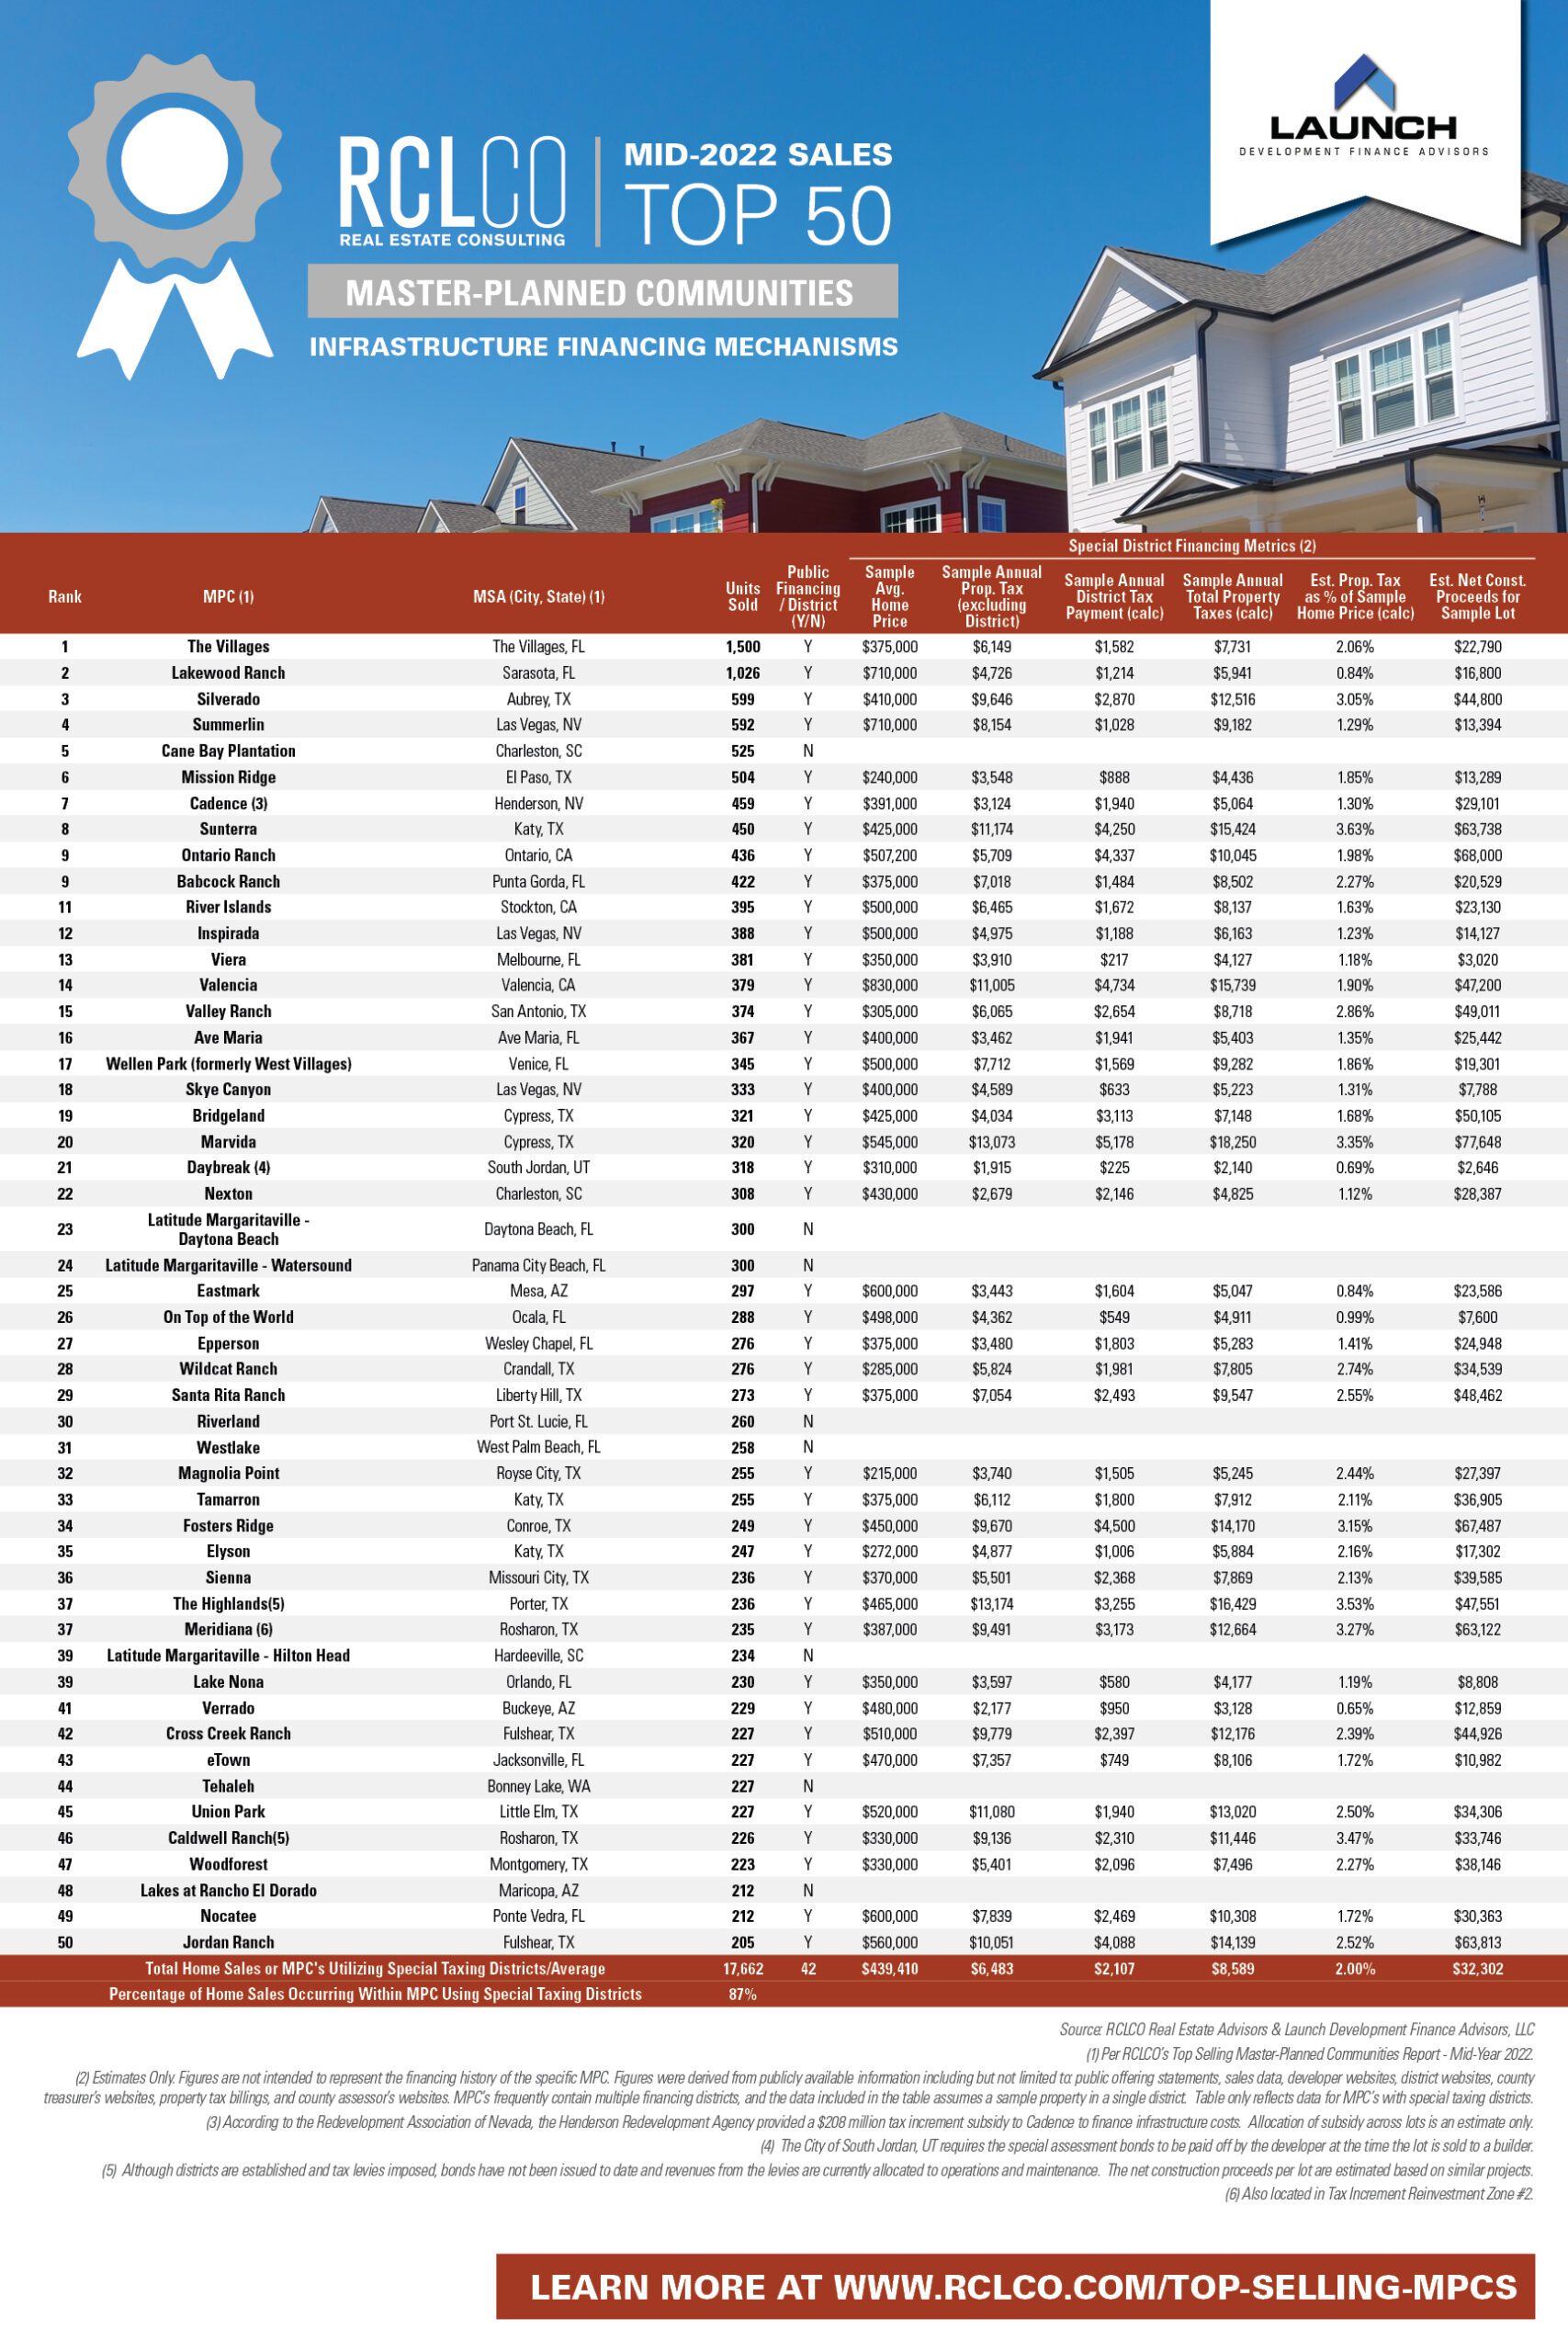
How are master-planned communities financing and constructing public infrastructure? RCLCO has teamed up with Launch Development Finance Advisors to investigate and found that a significant majority of home sales within the 50 top-selling master-planned communities occurred within communities using special purpose taxing districts. In addition, Launch and RCLCO have calculated the estimated net proceeds for a sample home in the Top-50 MPCs using average prices.
Key Takeaways:
Texas MPCs average the highest annual district payment as a percent of home price, at about 2.68%.
California MPCsaverage a slightly higher absolute district payment, at about $3,581, though this represents only 1.83% of average home price.
“The private sector now routinely uses public sector tools such as tax-exempt bond financing through special-purpose taxing districts including, but not limited to, community facilities districts (CA, HI, AZ), Special Improvement Districts (NV), Metropolitan Districts (CO), Public Improvement Districts (NM, TX), Municipal Utility Districts (TX) and Community Development Districts (FL) to create successful large scale development projects.”
– Carter T. Froelich, Managing Principal of Launch
Every year since 1994, RCLCO has conducted a national survey identifying the top-selling MPCs through a rigorous search of high-performing communities in each state. Our most recent report, The Top-Selling Master-Planned Communities of Mid-Year 2022, highlights the top-line sales figures of the leading MPC’s. In conjunction, RCLCO has been partnering with Launch Development Finance Advisors for years on providing financing and infrastructure data for these top-selling MPCs. See how MPC financing has changed from Year-End 2021, Mid-Year 2021, and Year-End 2020.
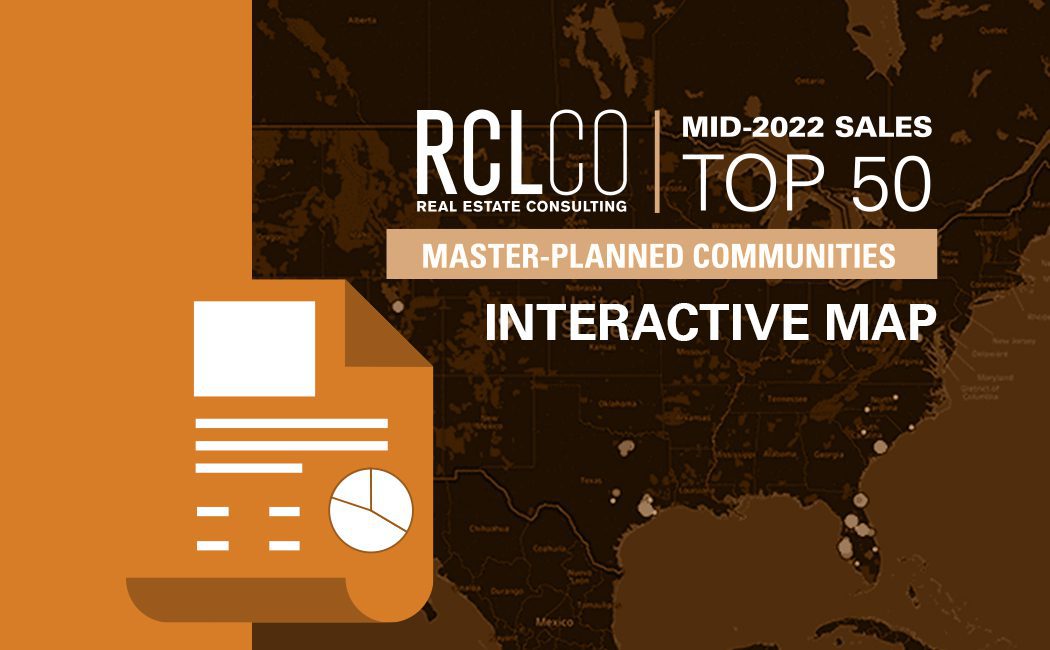
For more interactive data, be sure to check out the re-designed MPC Interactive Map, highlighting all past and present Top-50 MPCs
Disclaimer: Reasonable efforts have been made to ensure that the data contained in this Advisory reflect accurate and timely information, and the data is believed to be reliable and comprehensive. The Advisory is based on estimates, assumptions, and other information developed by RCLCO from its independent research effort and general knowledge of the industry. This Advisory contains opinions that represent our view of reasonable expectations at this particular time, but our opinions are not offered as predictions or assurances that particular events will occur.