August 13, 2026
Originally published via AFIRE
Summary
The office sector is gradually emerging from its long downcycle which was driven largely by pandemic disruptions and the shift to remote and hybrid work thatc restructured how and where the US labor force works. Typically, sectoral adjustment of the magnitude seen in the last five years would be infrequent, but with recent advances in Artificial Intelligence (AI), the office sector may face a second major restructuring just as it emerges from the last one. It remains to be seen how AI impacts US office markets, and economists forecast a wide range of possible scenarios.
Holding aside the uncertainty that AI introduces into the outlook, there are signs that the office sector has weathered the worst of its demand headwinds and is poised to begin recovery. Vacancies are still at record highs of 16.1% nationally, but tenant demand is improving which will boost net absorption and bring vacancies down. Performance remains varied by product type and market. Newer “NextGen” buildings – modern, amenity-rich, flexible spaces – continue to outperform older commodity office in both absorption and rents. AI has led to a boom in leasing in San Francisco even as other Gateway markets are starting to show more modest improvement. Office is not expected to be a top-performing property type in the near- to mid-term, but as the recovery takes shape, there will be opportunities in top office properties in strong submarkets.
Demand Drivers
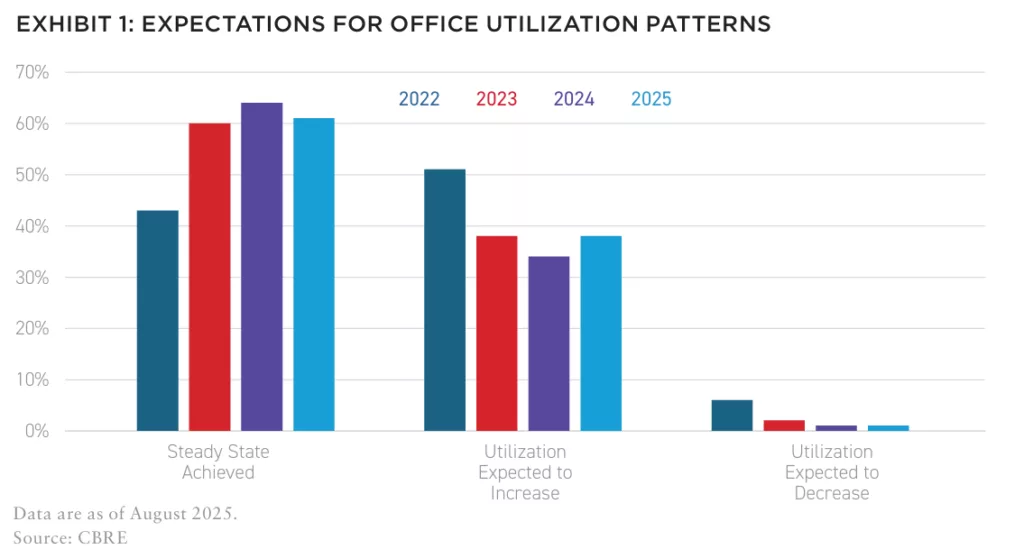
The shift to remote and hybrid work, accelerated by the pandemic, has stabilized in recent years. Over the last three years of an annual survey conducted by CBRE, only 1-2% of respondents have expected their office utilization rates to decrease. In contrast, the share of respondents expecting utilization to increase rose from 34% in 2024 to 38% in 2025, indicating that employers are increasingly considering heavier office usage. Despite this movement, the vast majority (61%) still expect that their office utilization has achieved a steady state. While this does not represent a tailwind for office demand, it does suggest that the sector has absorbed most of the headwinds from the remote work revolution for now.
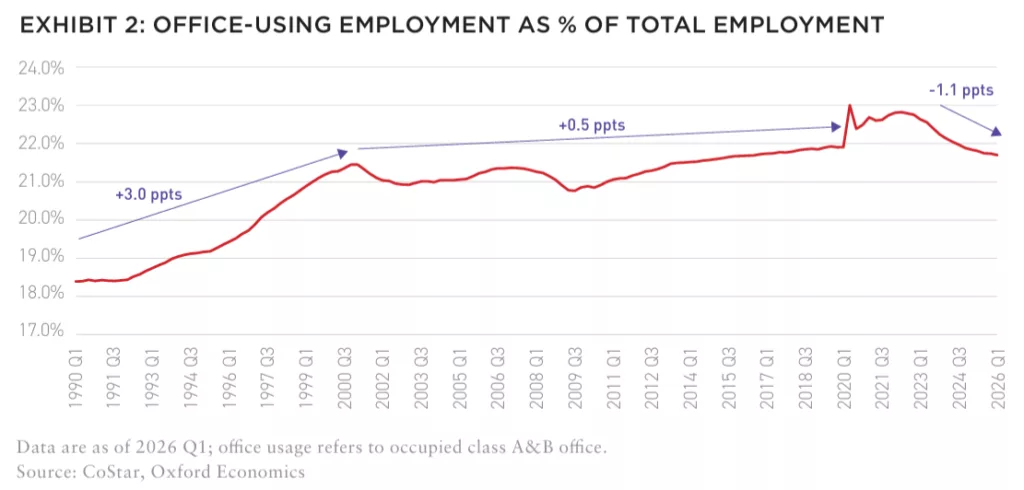
The proliferation of remote and hybrid work over the last five years has blurred the line between office-using and non-office-using employment sectors. Increased adoption of Artificial Intelligence (AI) will further complicate that distinction as sectors shift hiring and work requirements to adapt to AI advances. Despite these considerations, growth in traditionally office-using employment sectors1 remains an important demand driver in the space. Office-using employment growth has slowed relative to total employment in the US. As growth in the share of the workforce using office space slows, office real estate requirements will naturally decrease. Office-using employment grew steadily as a percent of total employment from 1990 through 2001, rising from 18.4% to 21.4% of total employment. From 2001 to early 2020 before the onset of COVID-19, its share rose modestly to 21.9%. Since 2022, the share of office-using employment has declined amid job losses in the information and financial activities sectors, but it remains near its pre-pandemic rate at 21.7% as of early 2026. How AI impacts office-using employment and how that translates to office demand remains to be seen, with a wide array of potential outcomes.
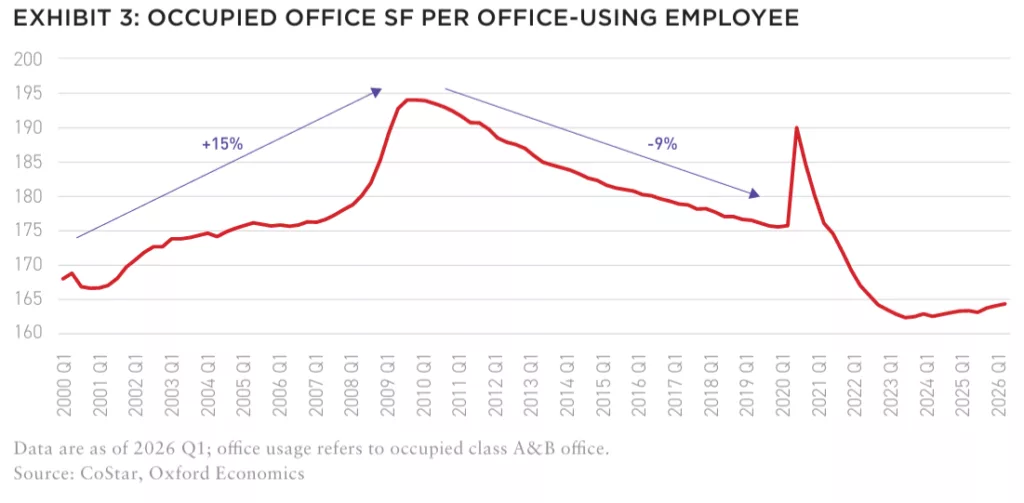
Another headwind for office demand is the increasing densification of office usage, which entails lower tenant leasing requirements. In the early 2000s, the ratio of occupied office square feet per office-using employee steadily increased (despite a brief lull from 2004-2007). Office SF per employee grew 15% from 168 SF in 2000 to 194 SF in 2009. Per-employee office usage subsequently declined to 176 SF per employee just before the pandemic hit. After pandemic disruptions, it hit an all-time low of 162 SF in 2023. The ratio has since stabilized and slowly begun to increase, again suggesting that office demand has absorbed most of the recent sectoral disruptions and may be poised to recover. However, the threat of further disruption from AI remains on the horizon.
Despite the challenged outlook for office overall, demand will likely hold up relatively better in new, high-quality office buildings in markets with robust employment growth. RFA refers to these top-tier offices as “Next Generation” or “NextGen” office. NextGen offices are new, innovative buildings that incorporate modern technology and are tailored to meet the needs of 21st century office tenants as they reconsider space functionality and increasingly prioritize the employee experience. NextGen office features typically include:
- Contemporary design features including natural light and outdoor spaces
- Maximum tenant flexibility and customization
- Employee wellness features (e.g., fitness centers, bike storage, shower facilities)
- Emphasis on environmental initiatives (e.g., LEED or WELL certification, ecofriendly
operations to reduce footprint) - Technology integration (e.g., wireless building systems, charging stations, dynamic
windows) - Proximity to lifestyle amenities like retail and dining
Market Fundamentals
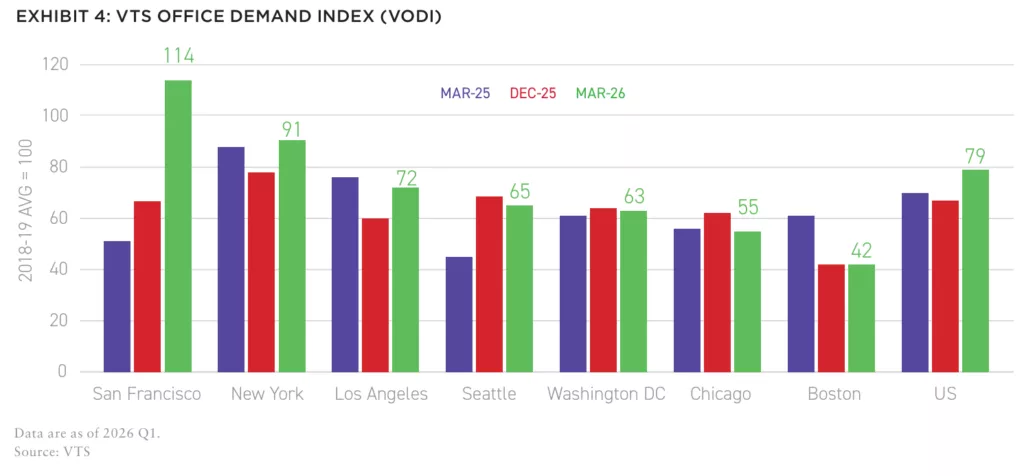
Against the backdrop of generally stabilizing office demand drivers, tenant interest ticked up in 2026 Q1 as seen in the VTS Office Demand Index (VODI) which tracks tenant touring activity. Nationally, the index rose 13% year-over-year, although it remained 21% below its pre-pandemic average level. Demand varied across major office markets. San Francisco experienced the sharpest demand increase, driven largely by AI and AI-adjacent companies increasing office requirements in the tech hub. Office tenant interest in the market surged to 14% above its pre-pandemic average, the only market to achieve that milestone. Other major markets like New York and Los Angeles also recorded stronger levels of demand despite remaining near their levels from a year ago. On the other hand, indicated demand in Boston, Chicago, and Washington, DC remain far below pre-COVID levels.
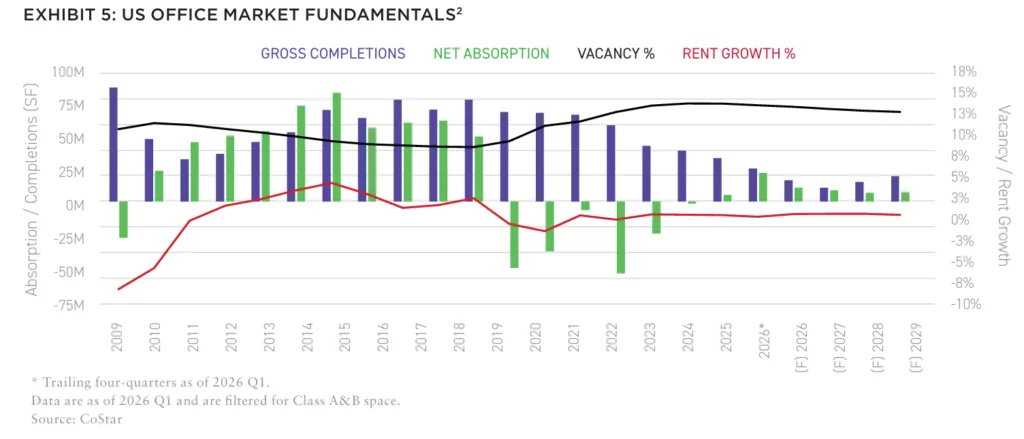
Office market operating fundamentals remain challenged but modest recovery looks likely in the near term. For the first time in six years, trailing-year net absorption turned positive in 2026 Q1 even though it remained low at 5M SF (0.1% of stock). Gross completions far outpaced absorption at 34M SF, keeping vacancies high at 16.1%. Annual rent growth remained modest but positive at 1.6% nationally. Net absorption is projected to improve further in the coming years as new supply tapers, supporting declines in vacancies that have likely peaked. The sector seems to have weathered the worst of the recent downcycle, and green shoots may be starting to emerge. Office overall is unlikely to become an outperformer in the near term, but there will likely be opportunities in select office properties in top submarkets.
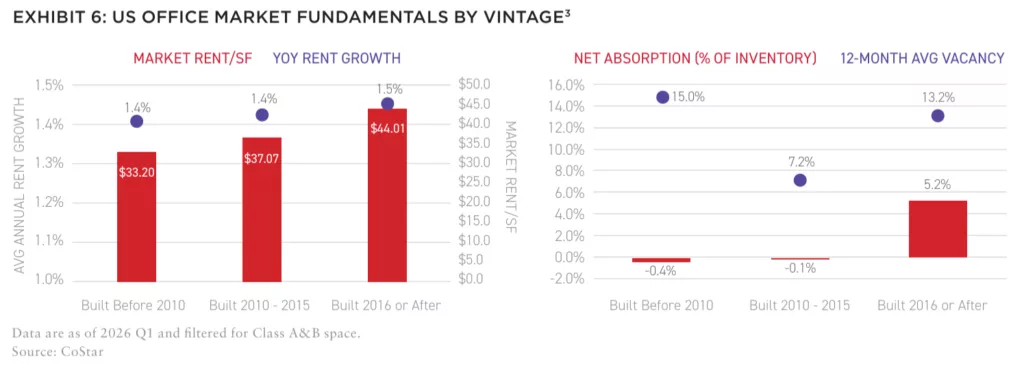
Office fundamentals continue to vary across properties as Next Generation office outperforms traditional office. Newly built offices have maintained stronger absorption relative to the broader office sector even as vacancies remained elevated at 13.2%. Some of this is likely due to newer buildings still in lease-up or initial leases expiring. Rent growth in new offices was modest at 1.5%, but new office space continues to command a rent premium compared to older space. High quality, newly built offices are positioned to outperform older stock as more employers choose newer office space.
Rent growth in new offices was modest at 1.5%, but new office space continues to command a rent premium compared to older space.
Capital Markets and Returns
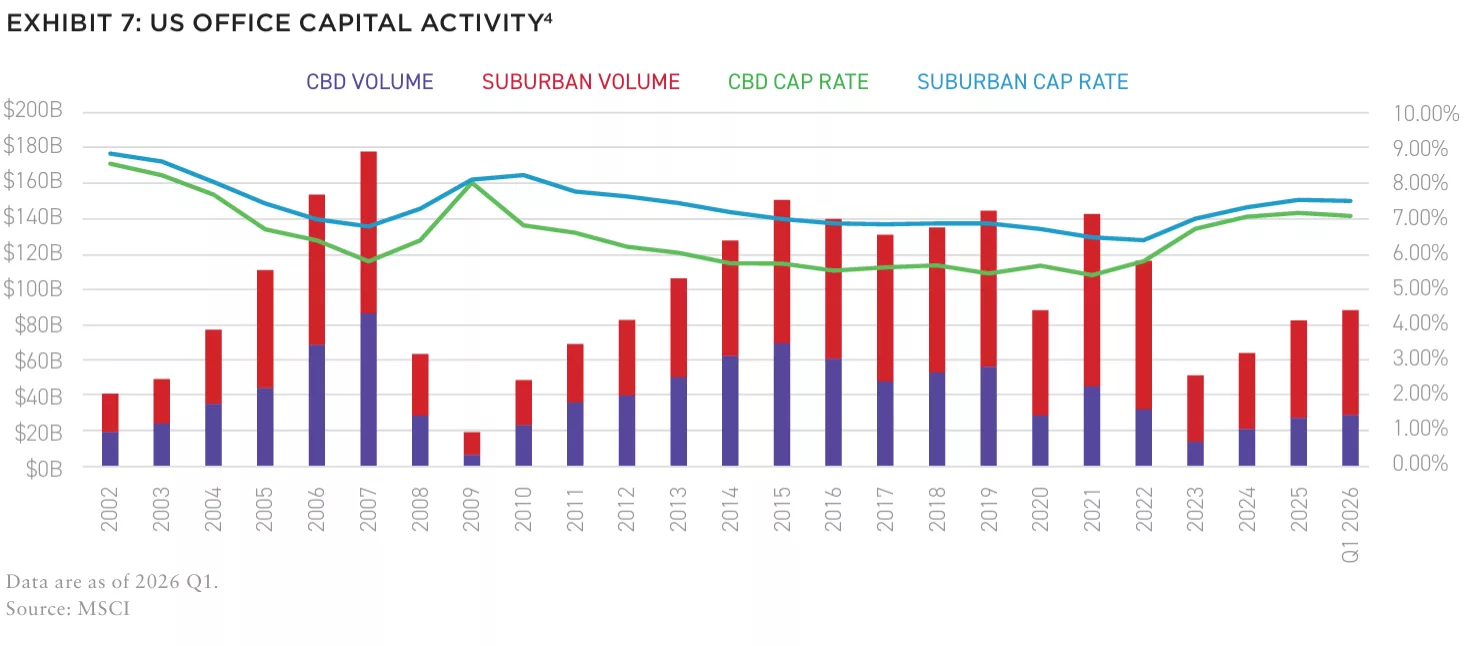
Office transaction activity picked up as capital markets recovered in 2025, and trailing-year transactions totaled $88B as of Q1 2026, up 41% from the year prior. Approximately 68% ($59B) of total office transactions were for offices in suburban locations with the other 32% ($28B) consisting of offices in central business districts (CBDs). Suburban office cap rates expanded by 5 bps YoY to 7.48% while CBD cap rates contracted 7 bps to 7.06%. The spread between CBD and suburban office cap rates has widened in recent quarters, but it remains far tighter than its historical average.
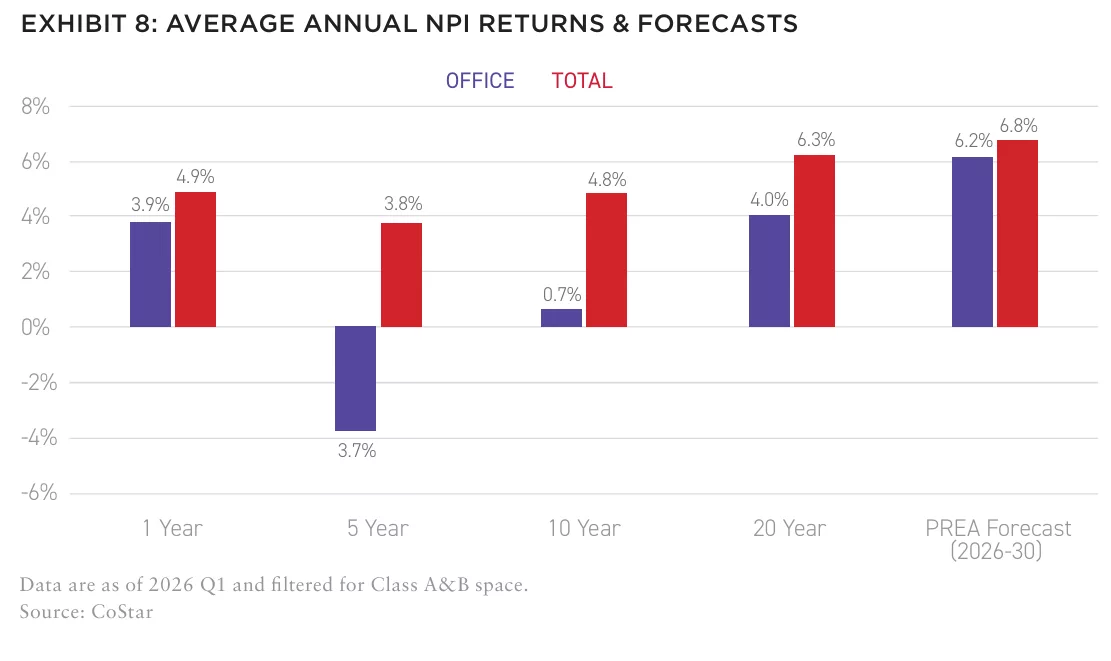
Office returns have been unfavorable relative to other property types in the NCREIF Property Index (NPI). Over the last year, the total NPI posted a 4.9% return while office registered a 3.9% return, the worst of all four major property types. In the medium and long term, the office sector has also underperformed. Over the last twenty years, office averaged an annual return of 4.0%, again the lowest of all major property types and well below the total NPI return of 6.3%. This trend is expected to persist over the next five years, although office’s degree of underperformance is projected to narrow. The PREA Consensus Survey forecasts office to return 6.2% annually through 2030 relative to 6.8% for the total NPI.
Conclusions
Office transaction activity picked up as capital markets recovered in 2025, and trailing-year transactions totaled $88B as of Q1 2026, up 41% from the year prior. Approximately 68% ($59B) of total office transactions were for offices in suburban locations with the other 32% ($28B) consisting of offices in central business districts (CBDs). Suburban office cap rates expanded by 5 bps YoY to 7.48% while CBD cap rates contracted 7 bps to 7.06%. The spread between CBD and suburban office cap rates has widened in recent quarters, but it remains far tighter than its historical average.
Office returns have been unfavorable relative to other property types in the NCREIF Property Index (NPI). Over the last year, the total NPI posted a 4.9% return while office registered a 3.9% return, the worst of all four major property types. In the medium and long term, the office sector has also underperformed. Over the last twenty years, office averaged an annual return of 4.0%, again the lowest of all major property types and well below the total NPI return of 6.3%. This trend is expected to persist over the next five years, although office’s degree of underperformance is projected to narrow. The PREA Consensus Survey forecasts office to return 6.2% annually through 2030 relative to 6.8% for the total NPI.
Notes
[1] Office-using employment includes information; finance & insurance; real estate, rental, & leasing; professional, scientific, & technical services; management of companies & enterprises; and administrative & waste services.
[2] Data are filtered for Class A&B office; absorption are rolling four-quarter totals; rent growth and vacancy are rolling four-quarter averages; rent growth refers to market asking rents.
[3] Data are filtered for Class A&B office; absorption and completions are rolling four-quarter totals; rent growth and vacancy are rolling four-quarter averages; rent growth refers to market asking rents.
[4] Figures are for quarterly transaction volumes and rolling four-quarter average cap rates.
Disclaimer: Reasonable efforts have been made to ensure that the data contained in this Advisory reflect accurate and timely information, and the data is believed to be reliable and comprehensive. The Advisory is based on estimates, assumptions, and other information developed by RCLCO from its independent research effort and general knowledge of the industry. This Advisory contains opinions that represent our view of reasonable expectations at this particular time, but our opinions are not offered as predictions or assurances that particular events will occur.