- Annual headline CPI inflation rose 30 bps to 3.7% and core inflation rose 20 bps to 2.6% in September.
- Annual Final Demand PPI and All Commodities PPI rose by 6.3% and 12.8%, respectively. Construction materials prices rose by 11.0%.
- The 10-Year UST yield ended September at 5.29%, up 54 bps from the end of August and its highest month-end rate since 2002.
- The Federal Reserve increased rates at its September meeting, and an additional rate increase is possible in 2026. The current rate target range is 3.75-4.00%.
- Employment grew by 29K in September, below expectations. Three-month average job growth stood at 51K.
- Annual wage growth fell 10 bps to 3.0% in September. Over the last three months, wage growth decelerated to 2.4% (annualized).
- Average 30-year mortgage rates climbed in September and reached 7.4% in early October. Annually, new home prices fell by 1.7% but rose 1.3% for existing homes.
* Latest data available.
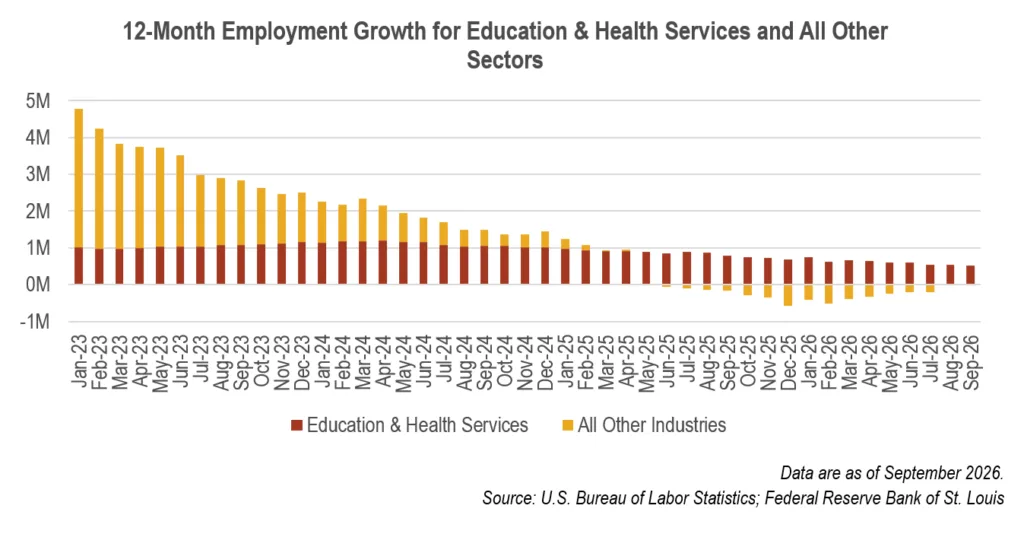
U.S. job growth has slowed sharply since early 2023, with gains increasingly concentrated in the education and health services sector. Employment across all other industries has declined since mid-2025. Over the 12 months ending in September 2026, education and health services added 516K jobs, offsetting a net loss of 20K jobs across all other sectors.
Sign Up to Receive RFA Investment Research
Register below to get access to RFA’s published research and thought leadership. Once verified, investors will begin to receive all RFA knowledge sharing via email: