November 14, 2022
The annual STEM Job Growth Index (“STEMdex”), now in its sixth year of publication, highlights the key metropolitan areas that represent current strongholds of STEM employment, as well as those that are likely to see positive growth in these industries over the coming years. RCLCO began publishing the STEMdex Advisory with the support of CapRidge Partners in 2016. CapRidge, a commercial real estate investment firm based in Austin, is a market leader in light industrial and office investment, and has a deep familiarity with the benefits that a strong STEM market can bring to a local economy. In the six years since the first Advisory was published, the RCLCO STEMdex has become a recurring annual publication that represents a way to track the best and brightest future STEM markets
“Once again, the 2022 STEMdex does a great job of representing the cities that have put an emphasis on attracting young, educated talent to bolster their local economies. With an existing ecosystem of STEM professionals and a high quality of life, these cities will continue to outperform the US average. CapRidge continues to believe in the STEMdex as a predictor of future tenant and population behaviors to inform sound investment decisions.”
– Dan Terpening, Managing Director of CapRidge
STEM jobs (primarily but not exclusively those in Science, Technology, Engineering, and Mathematics) are among the highest paying and economically productive positions in a local economy and are traditionally characterized by a highly educated, diverse, and typically younger workforce. Approximately half of all STEM jobs are explicitly computer related, with Engineering representing the second largest share of the industry job market. In addition to tracking where the current concentration of STEM jobs are, RCLCO aims to project markets likely to experience strong growth due to demographic, quality of life, and business cost characteristics. RCLCO has identified key factors and metrics which have been historically correlated with past increases in STEM employment to produce a refined annual ranking accounting for both short and long term economic and demographic factors.
For this analysis, RCLCO looked at demographic and economic factors prevalent in the 50 largest United States MSAs (based on population). About 70% of the US’s total STEM employment can be found in these 50 markets, and the STEM positions pay an average of 69% more in salary than non-STEM positions within these markets ($104,000 compared to $61,000). These higher wages lead to increased economic output via a multiplier effect. The direct, indirect, and induced impacts of these STEM jobs have a greater than 2x multiplier on total US employment. It is estimated that nearly 70% of the US GDP is influenced either directly or indirectly by STEM employment(1). The indirect jobs are concentrated in support positions within STEM firms and the induced employment originates from industries who support these firms such as manufacturing, construction, and real estate. Attracting STEM jobs can serve as a fiscal boon to markets and bolster regional economies. In addition, a young and diverse workforce can energize a city and bring additional industries, tourism, and events.
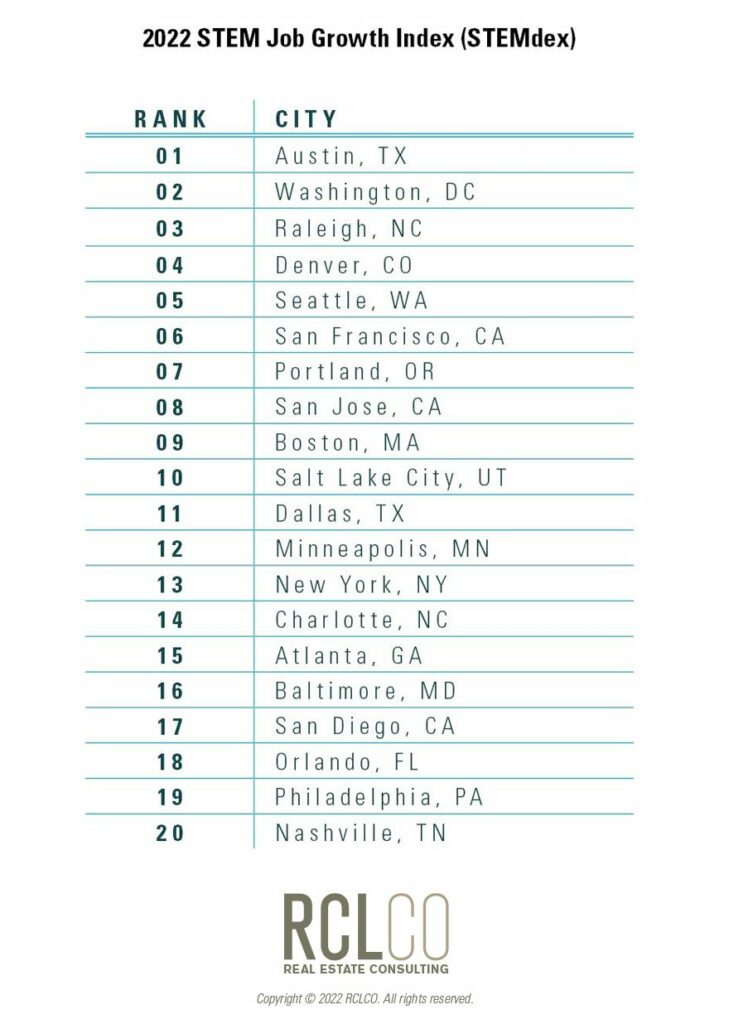
It is therefore important to identify the critical success factors for a market to attract these desirable, well-paying positions. In this report, RCLCO aims to highlight the key markets to watch for future STEM employment, while also recognizing that the presence of existing STEM jobs serves a major catalyst for new investment. The top 20 MSAs in the RCLCO STEMdex consist of communities already regarded for their ability to attract these types of jobs as well as up-and-coming cities that do not currently have an outsized share of these positions.
Methodology
RCLCO utilized 23 socioeconomic, business, and fiscal metrics to evaluate the employment prospects of the cities in the STEMdex. These data points were collected from 11 public and private sources including the US Census, the Bureau of Labor Statistics, and the Federal Aviation Administration. The metrics were then classified into one of four categories, as defined below:
Includes population growth metrics, industry specific growth, and STEM wages. The top three MSAs in this category include Austin, Seattle, San Jose, and San Francisco.
Measures educational attainment and millennial population factors. San Francisco, Denver, and Seattle have the top quality workforces.
Factors included in Quality of Life include cost of living, walk scores, and commute times among other metrics. Residents of Minneapolis, San Jose, and Washington DC enjoy some of the highest quality of life scores in the country.
Includes cost of doing business factors such as office costs and the local tax environment. Business Climate is inversely correlated with current Location Quotient levels, however it does remain an important factor for individuals and businesses that are considering a relocation. The relative importance of Business Climate will continue to be evaluated annually to ensure that the impact is property measured. The most business friendly metropolitan areas include Dallas, Las Vegas, Miami, and Orlando.
Utilizing historical data points, RCLCO has weighted the factors based on their historical significance and correlation in projecting future STEM job growth. One of the biggest predictors of future STEM job growth has historically been the existing presence of STEM jobs, although the education levels and quality of life of a workforce has also been shown to be a positive influence on future tech growth.
Where Are The Jobs Now?
Of the largest fifty MSAs, San Jose has the highest concentration of STEM jobs today. This is quantified through the Location Quotient (“LQ”), a metric that measures the relative concentration of an industry compared to the national average. The LQ for San Jose (colloquially known as Silicon Valley) is greater than 3.0, indicating that the share that STEM jobs in the local workforce is more than three times as high as the United States macroeconomic concentration. This is by far the highest LQ of the major United States MSAs. San Francisco, another major population core of Silicon Valley, has the third highest LQ.
The top 5 most heavily concentrated STEM markets – San Jose, Washington DC, San Francisco, Austin, and Boston all rank within the top 10 for projected future job growth. These cities have all been able to differentiate themselves as attractive markets for young, educated workers with their strong quality of life characteristics.
Key Markets to Watch: The 2022 STEMdex
Austin, Texas returns to the top-ranked spot after placing 2nd and 3rd in the last two annual publications of the STEMdex. This marks the fourth time in six years that Austin has ranked first. The city ranks among the top seven in STEM Trends, Workforce Quality, and Quality of Life, although the Business Climate is somewhat below average. This is fueled by the relatively high cost of class-“A” office space and comparatively light airport capacity – although there are plans in place to significantly increase capacity via the construction of a new concourse and runways. There was only one new entrant to the Top 20 of the STEMdex this year: Philadelphia, PA. The STEMdex rewards positive economic factors more than it punishes negative factors, and Philadelphia’s entrance into the top 20 says more about their local economy than the city they replaced, Houston, TX. Philadelphia scores above average in STEM Trends, Workforce Quality, and Business Climate.
Historically, a relocating household’s choice of location has been based on a balance between the quality of life that an area can provide, and the employment opportunities that are available in that location. While the widespread adoption of remote and hybrid work seen in 2020 and 2021 has moderated, an estimated 35% of workers have the option to work fully remote according to the McKinsey Institute – and 32% of workers take advantage of this opportunity. The opportunity to work from home is higher among high tech jobs, particularly those in computers, mathematics, architecture, and engineering. When competing for talent, firms are finding younger workers (Millennials and Older Gen-Z) have a higher preference for work-from-home, and are making employment decisions based on these preferences.
The opportunity to work remotely has motivated some migration out of higher cost-of-living coastal cities and has shifted the balance of quality of life and quality of employment decisions. The migration of fully remote workers to lower cost areas, where their salary goes farther, has taken as much as 10% of the city center spending out of the urban core, and into either other cities or into the suburbs. Cities like Tulsa, Oklahoma offered remote workers from outside markets a $10,000 grant to relocate for a full year to Tulsa due to the significant economic activity that the high-earning remote positions generate. The initiative attracted nearly 600 workers generating an estimated $13.77 in new local economic activity for every dollar spent by the city in the grant program(2).
Despite the ongoing trend of remote work and the migration of some employees into new, more affordable markets, the biggest STEM gains are still in markets with a strong base of tech employment and existing infrastructure. It is worth monitoring the degree to which the proliferation of remote work remains elevated and additional mid-sized markets such as Tulsa continue to make strides to attract talent and spending/tax revenue.
The STEMdex Top Five

Austin, Texas
» Prior Year: #3
» Population(3): 2,283,371
» STEM Location Quotient: 1.69
Austin, Texas is currently enjoying a historically tight labor market, with the unemployment rate dipping to 2.8% in August. If you want a job in Austin, you can find one. The city ranked second nationally in Major MSA GDP growth, with the local economy growing 4.3% over the last 12 months compared to a stagnant broader US macro-economy per the University of North Carolina Kenan-Flagler Business School. In recent years, several Silicon Valley mainstays such as Alphabet, Amazon, and Tesla have relocated thousands of jobs and expanded their office and manufacturing footprints in and around the city. Strong in-migration and the influx of high-paying jobs has driven home appreciation and multifamily rent levels upward impacting the local cost of living index. Despite this, the city remains one of the most popular destinations for recent college graduates and the cities numerous food and entertainment festivals keep the city attractive for all ages.

Washington, DC
» Prior Year: #5
» Population(3): 6,385,162
» STEM Location Quotient: 1.93
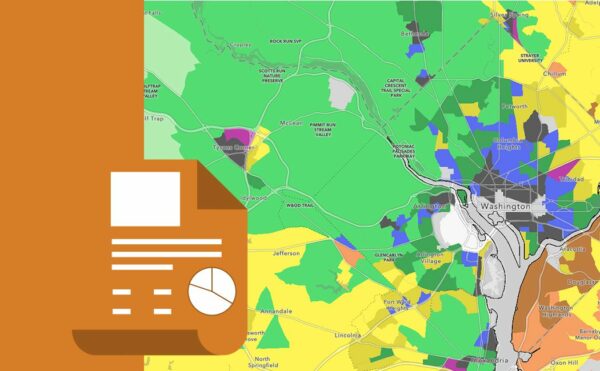
The nation’s capital has moved up from the fifth spot in last year’s ranking. This rise was buoyed by some of the strongest projected net in-migration over the next five years, some of the highest average wages, the highest educational attainment score, and some of the best city-wide walk/bike/transit scores. Recent corporate announcements include TikTok’s parent company ByteDance leasing 50,000 square feet of space in Northeast DC, and Alphabet expanding their corporate presence in Downtown DC. Mayor Muriel Bowser and the Office of the State Superintendent of Education have kick-started initiatives to provide funding and opportunities for tech related education to all students in the local school districts; from Kindergarten to 12th grade. Georgetown University was recently ranked as one of the 25 best colleges in the county and attracts top high school students every year.

Raleigh, North Carolina
» Prior Year: #7
» Population(3): 1,413,982
» STEM Location Quotient: 1.63
Raleigh-Cary Metropolitan Statistical area, the North Carolina Research Triangle, ranks among the strongest markets for STEM Trends, Workforce Quality, and Quality of Life along with above average Business Climate fundamentals. The region benefits from the proximity to some of the countries’ most prominent research institutions of higher learning including Duke University, NC State, and UNC-Chapel Hill. Major private employers in the market include American Airlines, Cisco Systems, and Qualcomm. In 2021, there were a record 217 venture capital investment deals and year-to-date fundraising ranks the market 13th in the country (by deal count, not dollar volume) per PitchBook.

Denver, Colorado
» Prior Year: #1
» Population(3): 2,963,821
» STEM Location Quotient: 1.58
While still a top market Denver shifted lower in the rankings this year, primarily driven by gains in other markets as opposed to any losses experienced by this dynamic and high-ranking market. The mile-high city ranks near the top of the country in STEM Trends, Workforce Quality and Business Climate but just “average” in Quality of Life. The average quality of life score is due to the area’s relatively high cost of living, both in terms of homeownership and rent levels. The area’s sprawling development results in significantly high commute times from outlying areas into the urban core job centers. Some of the largest employers in Denver include SCL Health Systems, Century Link and Wells Fargo.

Seattle, Washington
» Prior Year: #2
» Population(3): 4,018,762
» STEM Location Quotient: 1.60
Seattle ranks as the top city by RCLCO’s Workforce Quality metrics and has been positioned in the top six overall in every edition of the STEMdex. Comparatively high office costs weigh down the metro’s ranking somewhat, but the Pacific-Northwest has remained an attractive destination for recent college graduates and highly educated and skilled workers. In addition to representing the primary headquarters of Amazon (45,000 employees) and Tableau (2,000 employees), Seattle is home to dozens of tech startups and ventures and represents one of the most educated and diverse metropolitan areas in the United States.
Article and research prepared by Gregg Logan, Managing Director; Karl Pischke, Principal; and Ryan Guerdan, Senior Associate.
(1) STEM and the American Workforce; 2020
(2) Per the Economic Innovation Group’s November 2021 Report: How Tulsa Remote is Harnessing the Remote Work Revolution to Spur Local Economic Growth
(3) Per 2020 Decennial Census; MSA level population
Reasonable efforts have been made to ensure that the data contained in this Advisory reflect accurate and timely information, and the data is believed to be reliable and comprehensive. The Advisory is based on estimates, assumptions, and other information developed by RCLCO from its independent research effort and general knowledge of the industry. This Advisory contains opinions that represent our view of reasonable expectations at this particular time, but our opinions are not offered as predictions or assurances that particular events will occur.
Copyright © 2022 RCLCO. All rights reserved. RCLCO and The Best Minds in Real Estate are trademarks of Robert Charles Lesser & Co. All other company and product names may be trademarks of the respective companies with which they are associated.
Disclaimer: Reasonable efforts have been made to ensure that the data contained in this Advisory reflect accurate and timely information, and the data is believed to be reliable and comprehensive. The Advisory is based on estimates, assumptions, and other information developed by RCLCO from its independent research effort and general knowledge of the industry. This Advisory contains opinions that represent our view of reasonable expectations at this particular time, but our opinions are not offered as predictions or assurances that particular events will occur.