
December 14, 2022
Originally published via AFIRE
Even as the US office sector has lagged other property types, there could be an important (and valuable) difference of office performance based on property age and market.
US office performance has lagged other property types and the overall NCREIF Property Index (NPI) in both total returns and net operating income (NOI) growth for at least past twenty years. This overall trend, however, masks variations within the sector as office properties bifurcate between “have” and “have not.” Have-not properties struggle to maintain current values as NOI growth is weak (or negative) and required capital expenses detract from value, while “have” properties are able to grow NOI and increase values. Using NCREIF data, this article examines the bifurcation of office performance based on property age and market.
The Office Sector
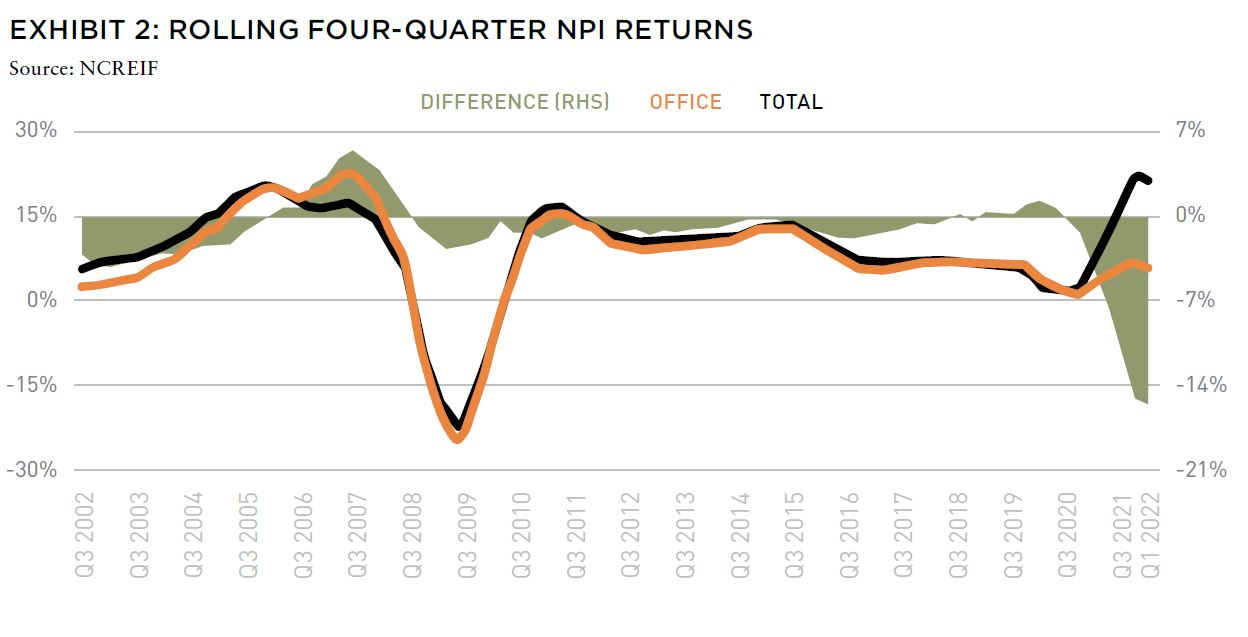
The US office sector has underperformed overall real estate over the last two decades, with returns averaging 7.4% annually, trailing total NPI returns by 160 BPS (Exhibit 1). There were brief periods of moderate out-performance just prior to the Global Financial Crisis and the COVID-19 pandemic, but office underperformed the overall index for most of the past twenty years (Exhibit 2). The margin of underperformance widened more recently.
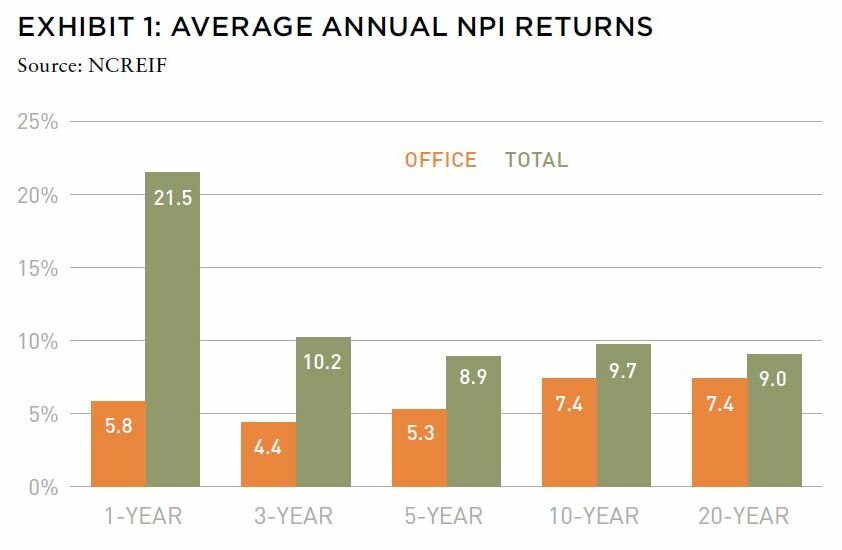
Partly due to underperformance (as well as investor shifts to industrial and apartments), office’s share of NPI declined precipitously over the past several years. Office’s market value in NPI continues to increase in absolute terms, but its share of total market value decreased to 27% in 2022 from 42% in 2000.
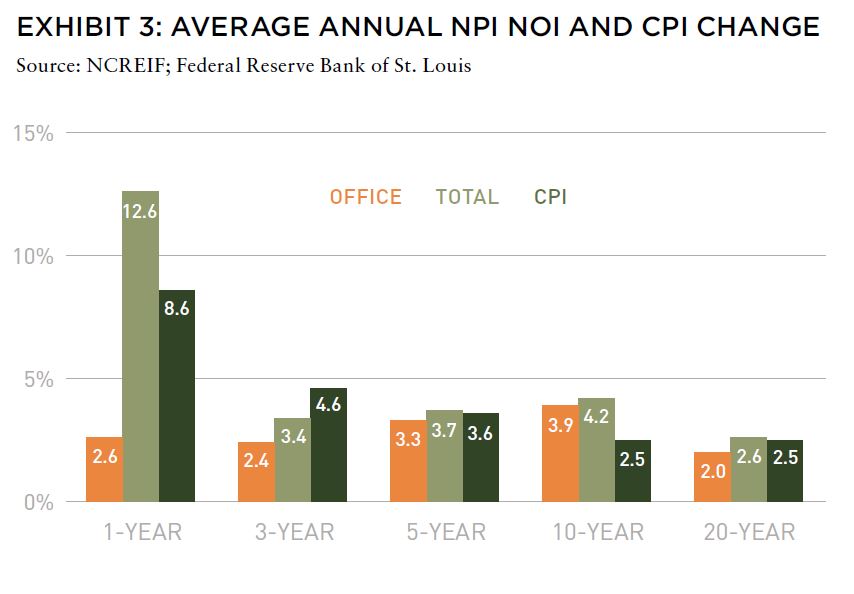
Recent industrial outperformance has been one contributing factor to office under-performance, but weak office NOI growth and elevated capital expenditures also dragged on office returns. Office NOI growth2 has averaged 2% annually over the past twenty years, trailing CPI inflation by 50 BPS and total NPI NOI growth by 60 BPS (Exhibit 3). Most recently, total NOI growth hit a twenty-year high, increasing 12.6% over the last year due in part to apartment and retail properties recovering from COVID related declines. In contrast, office NOI grew only 2.6% over the past four quarters.
In addition to being newer (<10 years old), NextGen office caters to more recent work trends like the growing demand for collaborative and flexible office space, outdoor space, and access to other lifestyle amenities like gyms and restaurants.
Newer Office Properties Are Outperforming
Despite the poor performance of office as a whole, newer office properties (what we call Next Generation/NexGen properties) have materially outperformed the overall sector in terms of total returns and NOI growth. In addition to being newer (<10 years old), NextGen office caters to more recent work trends like the growing demand for collaborative and flexible office space, outdoor space, and access to other lifestyle amenities like gyms and restaurants.
Based on NCREIF performance data, NextGen office has outperformed other office properties and, in some cases, the overall NCREIF universe, over the past ten years. NOI growth in recently built offices has outpaced growth in older office properties, averaging 9.2% annually over the last five years (Exhibit 4), nearly three times the average growth rate for all office and two and a half times total NPI NOI growth. However, as most of the US office stock is older, office buildings that are ten years old or less make up only 15% of NPI office market value (Exhibit 5), potentially placing a scarcity premium on these properties.
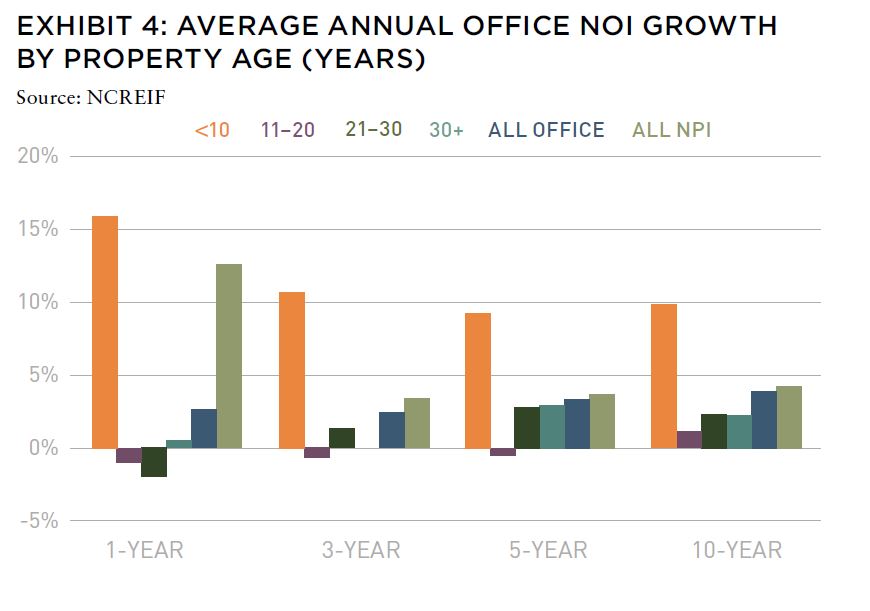
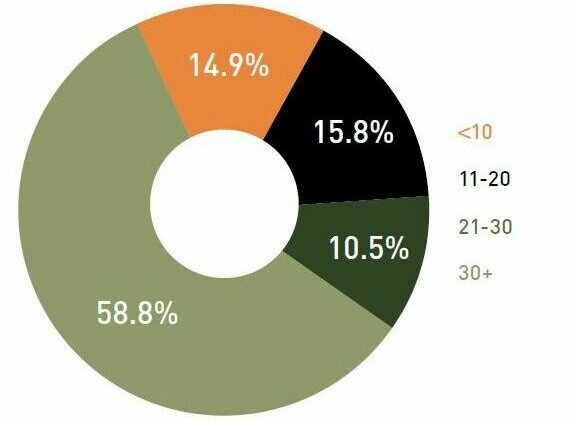
By market value, nearly 60% of NPI office is more than thirty years old, and this older stock often suffers from muted demand because it lacks many of the modern amenities increasingly desired by office tenants. Notably, office buildings between eleven and twenty years old have seen the lowest NOI growth over most time horizons with average annual NOI growth of -0.5% over the past five years and 1.1% over the past ten years. This is possibly due to significant tenant turnover during that time frame as initial leases expire.
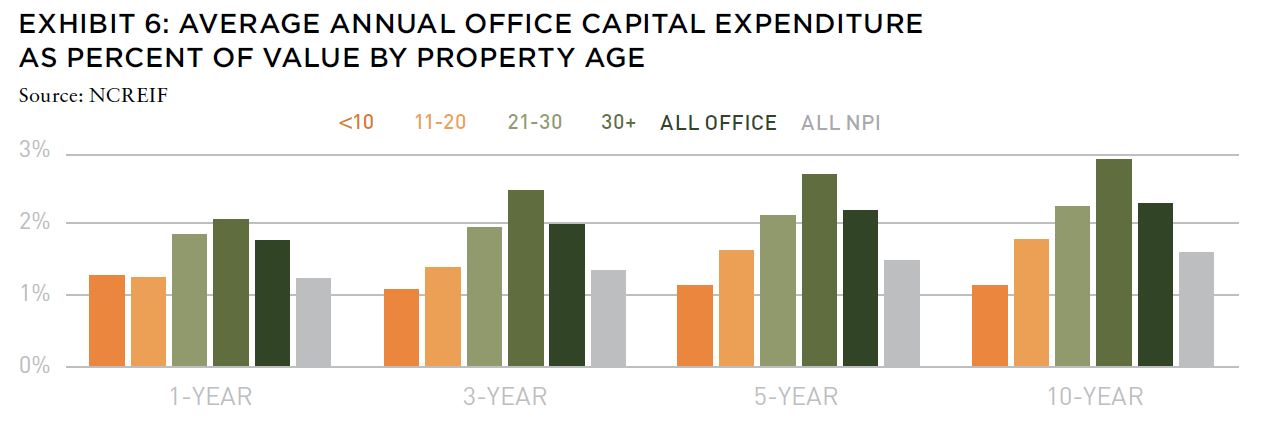
In addition to weak NOI growth, older offices have elevated capital expenditures (Exhibit 6). NPI office as a whole averaged annual capital expenditures at 2.2% of market value over the last five years, the highest of the four main property types and well above the total NPI average of 1.5%. Offices older than thirty years old recorded even higher capex, averaging 2.7% of market value. Conversely, newly built office capital expenditures have been around 1.1% of value over the past five years, below the total NPI average.
Taken together, weak NOI growth and high capex have led to low returns, particularly for older office product (Exhibit 7). Newer office has outperformed older office but has fallen short of total NCREIF Property Index (NPI) returns in both the short and medium term. Over the four quarters ending in 2Q 2022, total NPI grew to record highs, posting a 21% return. The total return of office properties in the NPI remained far more modest at just 5.3%, but returns for newly built office were over double that figure at 11%. Apartments and industrial both outperformed new office in the recent real estate rally with trailing one-year returns of 24.4% and 47.7%, respectively. Over the longer term, newer office properties have outperformed older buildings, with a ten-year return of 8.7%, but have lagged the overall NPI, which delivered a 9.5% average annual return.
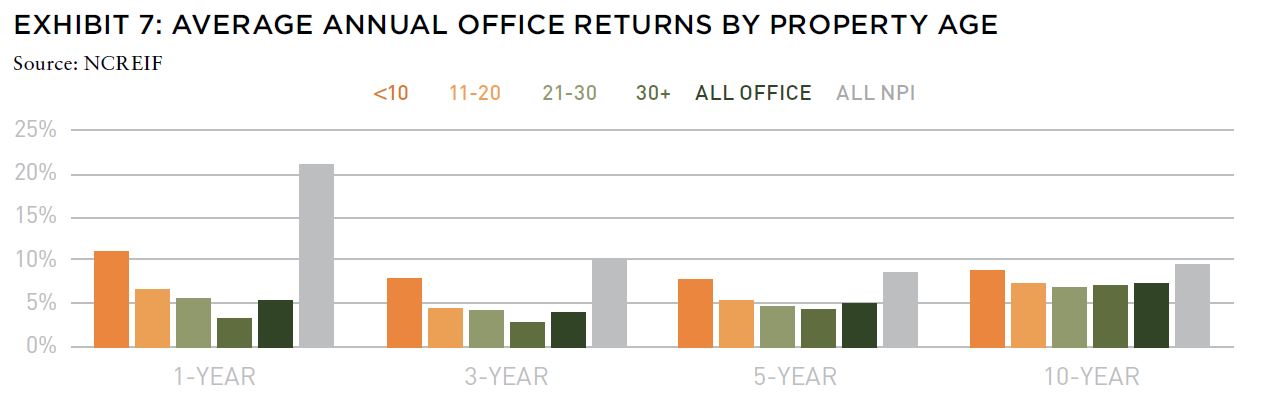
Over the longer term, newer office properties have out-performed older buildings, with a ten-year return of 8.7%, but have lagged the overall NPI, which delivered a 9.5% average annual return.
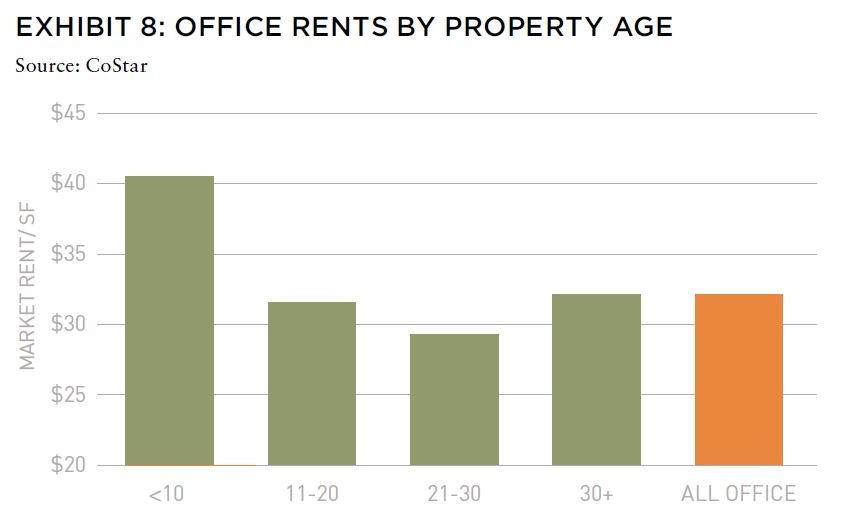
New office buildings charge premium rents and are forecasted to see marginally stronger rent growth than older offices over the next five years (Exhibit 8). Nationally, market rents average approximately $40/SF in offices 10 years old or newer, 25% above all office average rents. According to CoStar, newer office rents are also projected to grow 1.6% annually over the next five years, surpassing all office average rent growth by 40 BPS. Elevated rents and faster rent growth will in turn drive continued NOI growth and ultimately returns.
Office Performance by Market
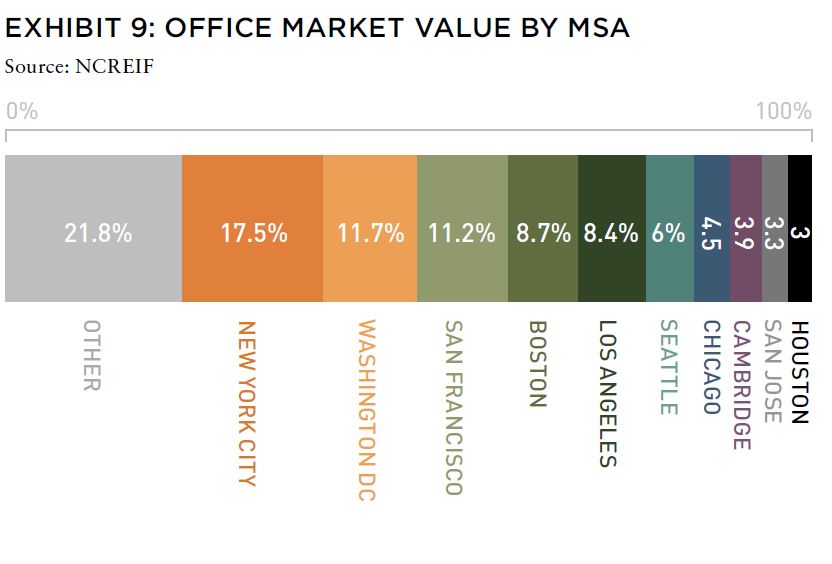
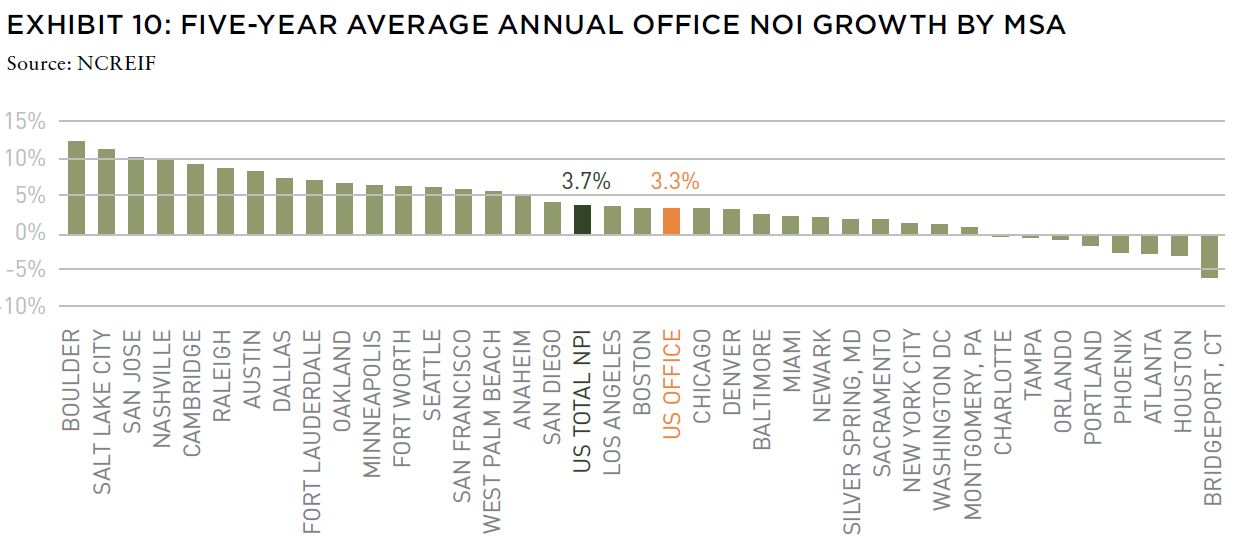
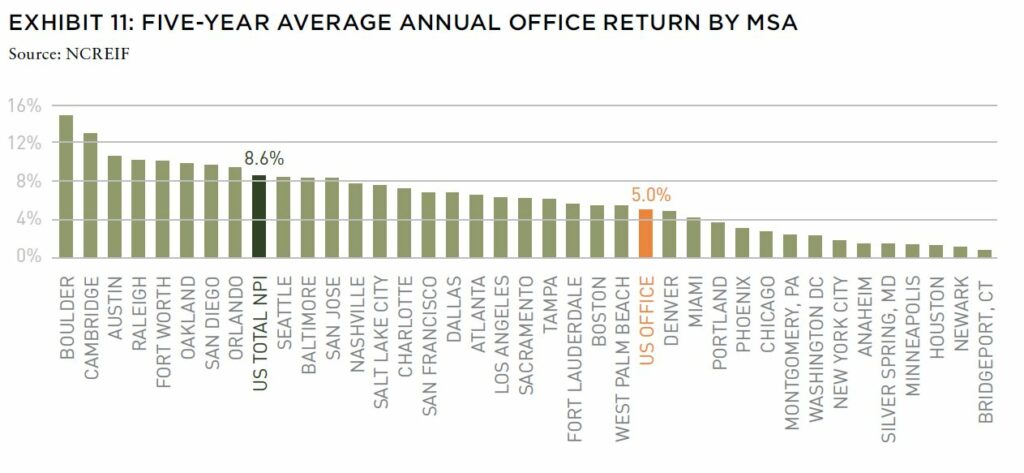
In addition to age of building, office performance also varies widely by market. Nearly three-quarters of NPI office market value is concentrated in the traditional gateway markets (Exhibit 9). The two largest markets—New York City and Washington, DC—have performed poorly over the last five years with low NOI growth (Exhibit 10) and total returns (Exhibit 11). Despite making up 29% of office market value, they have driven just 10% of NPI office’s NOI growth and 11% of total returns over the last five years. Other large markets—notably San Francisco, San Jose, Los Angeles, and Cambridge—have performed better. Cambridge, San Jose, and Oakland collectively constitute 9% of NPI office market value, but over the last five years, these markets drove 22% of office NOI growth and 18% of total returns.
Many of the top performing office MSAs are “quality of life” markets with robust life science and tech sectors. Office NOI growth has been strongest in large life science markets such as Cambridge and the San Francisco Bay Area, and in smaller but growing life science markets, such as Boulder and Raleigh. The same trend holds for total office returns. Cambridge, a major biotech hub, is the largest office market to earn outsized five-year average returns, outperforming total NPI by 440 BPS. Several smaller office markets with active life science sectors also outperformed the NPI; notably Boulder, Raleigh, and San Diego.
The strong performance of life science markets is not surprising. Both scientific breakthroughs and venture capital activity has favored life science/biotech companies. Most biotech work requires access to physical lab and office space, supporting office demand and shielding the sector from “work from anywhere” trends. Office in several biotech markets has outperformed total NPI over the last five years, suggesting that life science office may be an attractive investment opportunity within the broader office sector.
Investment Implications
Over the last two decades (or longer), the office sector has consistently lagged total NPI on both total returns and NOI growth. Investors have taken note, and office’s share of NPI market value has steadily declined while apartment and industrial shares have grown.
Within the office sector, the story is not unequivocally negative.
Strong NOI growth has driven higher returns for NextGen office properties built within the last ten years. In contrast, NOI growth and total returns at older office properties (particularly 11- to 20-year-old buildings) have been much lower (and at times negative).
While newer office buildings have outperformed older ones in total returns, they have underperformed the overall NPI. Office has also performed better in markets with strong tech and life science activity. Cambridge and the San Francisco Bay Area are two notable examples.
While a preponderance of older buildings will likely lead to underperformance for office as a whole for the foreseeable future, newly built offices and offices in tech and life science markets have shown more favorable signs; however, they must be evaluated relative to other property types.
These office subsectors may not prove to be diamonds, but they certainly seem to merit a closer look by investors.
Office in several biotech markets has outperformed total NPI over the last five years, suggesting that life science office may be an attractive investment opportunity within the broader office sector.
Disclaimer: Reasonable efforts have been made to ensure that the data contained in this Advisory reflect accurate and timely information, and the data is believed to be reliable and comprehensive. The Advisory is based on estimates, assumptions, and other information developed by RCLCO from its independent research effort and general knowledge of the industry. This Advisory contains opinions that represent our view of reasonable expectations at this particular time, but our opinions are not offered as predictions or assurances that particular events will occur.