June 3, 2026
By Adam Ducker, CEO, RCLCO; Grace Amoh, Senior Associate, RCLCO; Rosemarie Hepner, Vice President, ULI Terwilliger Center for Housing
Originally published via ULI
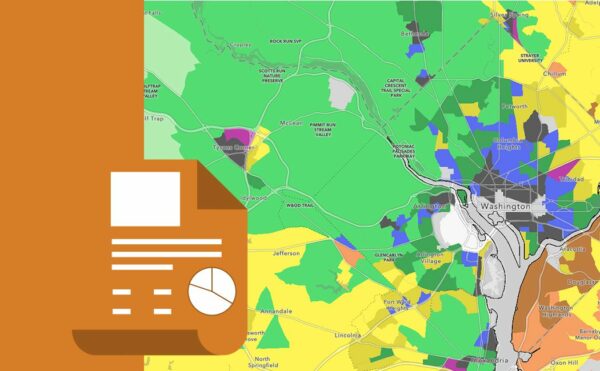
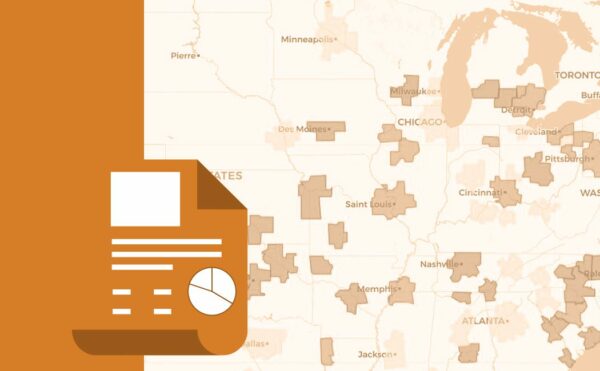
The Urban Land Institute (ULI) and research partner RCLCO, released the ULI Terwilliger Center for Housing’s 2026 Housing Index, a data-rich tool measuring affordability, connectivity, racial disparity, and growth across the United States at the Metropolitan Statistical Area (MSA). Featuring data visualization tools that allow users to explore both national and regional trends, this platform serves as an invaluable resource for industry professionals tackling today’s most pressing housing production, policy, and financing challenges.
The data can help:
- Identify gaps in home attainability and provide better context to understand residential markets
- Explicitly identify and highlight racial, socioeconomic, and intraregional disparities and inequities
- Enable national and regional comparisons to inform housing production, policy, and financing decisions
Building on previous years, the innovative new web app offers cutting-edge capabilities, including the ability to conduct comparative change-over-time data analyses. The 2026 iteration includes updated data, an easy-to-use Excel tool, and a comprehensive interactive map that tracks housing data at the tract, county, and MSA levels.
Key Findings
Share of cost burdened households has been increasing for a decade but has accelerated in the last several years
In nearly every major market across the United States, households earning under $50,000 are significantly more cost burdened than they were 10 years ago. This trend has accelerated in the last several years, particularly in the Western states, where now less than 30 percent of homes in many California metro areas are affordable even to households earning 120 percent of area median income.
Housing production continues to slow as activity shifts to underappreciated markets
The declining levels of housing production across the country are well documented, but the geographic pattern is new and unique in recent history. While high-growth and high-profile markets, particularly markets in the Intermountain West, such as Boise and Provo (Utah), continue to be at the top of the list, Indianapolis and Dayton, markets with an aging housing stock and strong local economies but not usually on investors’ radar, were in the top 10 last year.
Housing in America really is a local story
The cost of housing in America continues to see increasing polarity as the most expensive markets continue to diverge from the most affordable. Boston remains among America’s most expensive with an average two-bedroom across the metro area renting at $2,155 per month (and much higher in its urban cores), while Youngstown, Ohio, is roughly one-third the cost at $814 per month.
Housing development pushes farther into the suburbs
For several years, this data has shown an increasing level of new-home construction in the suburbs and declining levels in the urban core. Last year, activity moved further to the metropolitan fringe in most metros as low-density housing on low-cost land was one of the few construction-feasible product types.
No surprise, commute times are increasing in most markets, but resort markets saw the most dramatic shift last year
Coastal and mountain communities in Maine, Montana, South Carolina and Florida saw the highest change in the percentage of households commuting one hour or more as the housing shortage in many of these communities continues to push the labor force to distant housing options.
Full access to the interactive tool can be found on ULI’s Knowledge Finder.