Honey I Shrunk the Apartments: Average New Unit Size Declines 9.7% in 2010s Compared to Those Built in 2000s

Average New Apartment Size Drops by 100 Square Feet from the 2000s, but Steepest Decline from 2010-2014
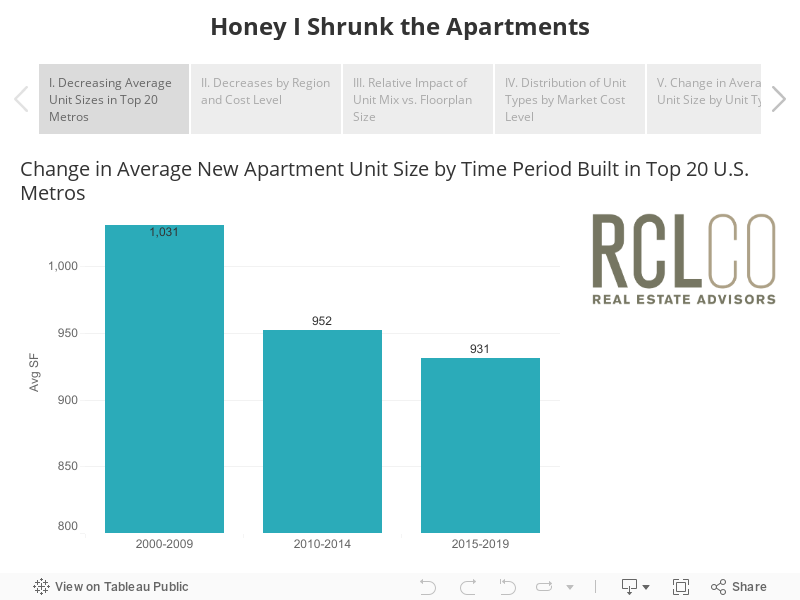
As of the end of 2019, the nation’s gravitation towards more affordable and centrally-located tiny living spaces had not fully abated. Findings from RCLCO’s previous study, which compared unit sizes built between 2000 and 2009 to those built between 2010 and 2016, indicated that the average new apartment unit decreased by 70 square feet, or 7%. In order to understand how these trends progressed through the end of the 2010s, RCLCO took another look at the newest apartment data.
Upon revisiting the top 20 U.S. metro areas, it is clear that four years later, the shrinking has continued but moderated. In the time period 2010-2014 average unit sizes decreased 7.6% compared to units delivered between 2000 and 2009. However, apartments built in the latter half of the most recent decade (2015-2019) shrunk only an additional 2.2% compared to those built between 2010 and 2014. The second portion of the decade gives us a lot to unpack; despite the overall decrease, this trend is no longer consistent across metros, market cost levels, or unit types (I. Decreasing Average Unit Sizes in Top 20 Metros).
Coastal Regions Continue to Drive Down Sizes
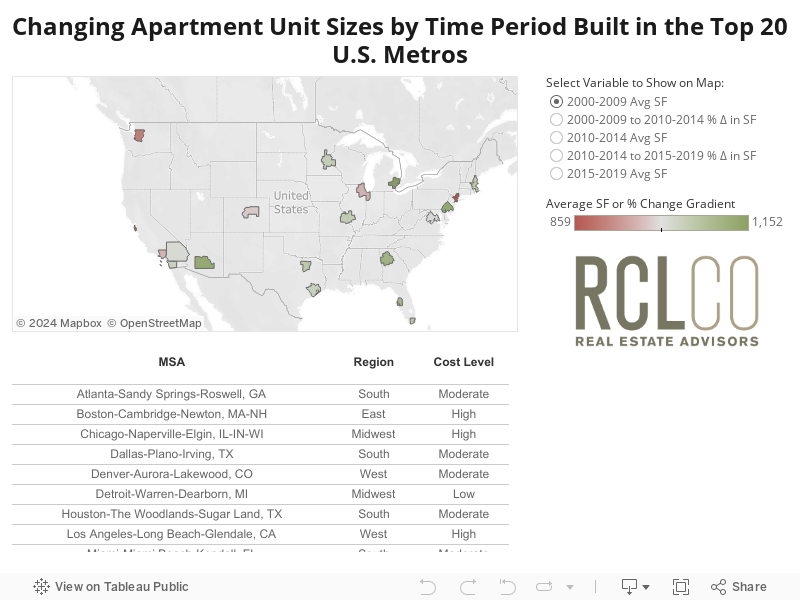
Consistent with RCLCO’s last study, the decline in unit size is a national trend, though only pronounced in coastal markets in recent years. Average unit size in the East and West regions experienced a continued 4% and 5% decrease for units built in the past five years compared to 2010-2014. In contrast, while the Midwest and South saw substantial size shifts from the 2000s to 2010-2014, the downsizing trend has moderated significantly in these regions, with minimal changes in average unit size over the past five years given less pricing pressure (II. Decreases by Region and Cost Level).
High-Cost Markets See Continued Downsizing, With Unit Sizes in Other Market Types Moderating in 2015-2019
Aggregating the markets by relative housing cost further emphasizes how pricing economics have driven this change in average unit sizes. Somewhat unsurprisingly, the size of new apartment units in high- and moderate-cost markets have decreased the most in the long-term, with units built in the last five years an average 13% and 8% smaller than those constructed in the 2000s decade. However, only in high-cost markets can a large part of this shift be attributed to building trends in 2015-2019. While moderate-cost markets experienced dramatic downsizing at the beginning of the 2010s, unit sizes built since stayed flat. Conversely, in high-cost markets, average unit sizes decreased a meaningful 45 square feet, or 5%, in the past five years relative to the 2010-2014 period (II. Decreases by Region and Cost Level).
Unpacking the Downsizing
In high-cost markets in particular, there continues to be similar demand fundamentals to very high-cost markets, but a lot more room to downsize units relative to those built in the previous decade. For example, the gap between average new unit sizes between San Francisco (very high-cost) and Los Angeles (high-cost) dropped from 106 square feet in 2000-2009 to just 78 square feet in 2015-2019.
Interestingly, low-cost markets saw no reduction in new unit sizes in the first part of the 2010s decade, but average unit size dropped to resemble moderate-cost markets since 2015. While there has been limited pricing pressure in these market cost categories compared to higher-cost markets, RCLCO has begun to see some impetus to push sizes down in select moderate-cost markets like Atlanta and Miami. This emerging trend can be monitored in both moderate- and low-cost markets over the coming decade.
Except in Very High-Cost Markets, Changes in Average Unit Size are Driven Primarily by Shifting Unit Mix
To unpack what is driving the change in average unit sizes, RCLCO parsed out the downsizing impacts attributable to 1) unit mix, and 2) floorplan sizes, isolating each variable to understand its impact. As market cost increases, the impact of unit mix tends to decrease. Unit mix explains all of the average unit size decrease in low-cost markets, compared to only 34% in very high-cost markets, as the highest-cost markets are already heavily weighted towards studios and one-bedrooms (III. Relative Impact of Unit Mix vs. Floorplan Size).
While very-high cost markets have seen the least change in unit mix, there has been a strong push to deliver studios across all market cost levels; studios as a share of total units have increased across the board, most notably in high-cost markets where studios as a share of units leaped from 6% in 2000-2009 to 15% in 2015-2019. Contrarily, during this same time frame, two-bedroom units as a share of total units dipped from 45% to 34%. Interestingly, low-cost markets, which had previously been heavily weighted two-bedroom units in the 2000s, have slowly conformed to higher-cost market trends: while one-bedroom units account for 36% of the total share of units in 2000-2009, by 2015-2019 this share climbed to 44% (IV. Distribution of Unit Types by Market Cost Level).
It’s Not All Shrinking – Two Interesting Outliers
While generally, the concentration of small unit types is growing and average floorplan sizes are decreasing, there is variation by market cost level and unit type. Consistent with past findings, three-bedroom sizes have actually increased in almost all markets to cater to move-down renters coming from single-family homes, and perhaps remain competitive with the emerging single-family rental market. While these floorplan sizes have grown, three-bedrooms as a share of the overall unit mix has declined (V. Change in Average Unit Size by Unit Type).
In terms of smaller unit types, the average floorplan size has continued to decrease for studios and one-bedrooms, especially in high-cost markets. Yet there is a notable exception: studios in very high-cost markets saw an increase in average floorplan size over the past decade, perhaps an indicator that there is a minimum unit size with broad appeal to renters. This is further supported by the fact that the share of very small units delivered (under 500 square feet) has decreased since the previous decade across all market cost levels. Despite favorable pricing economics, there is a limited renter pool that will consider very small floorplans, tipping the scales toward a “sweet spot” of small, yet livable floorplan sizes.
Substitution Effect
Honing in on this “sweet spot,” RCLCO has observed a noticeable substitution effect for select studio and one-bedroom unit sizes: floorplans between 700-800 square feet have experienced dramatic increases at the expense of those sized 800-900 square feet, due to favorable development economics. Although this trend has occurred in markets across cost levels, high-cost markets experienced this substitution the most. In high-cost markets from 2000-2009, 28% of all studios and one-bedrooms built were 700-800 square feet, but this share jumped to 66% by 2015-2019. Meanwhile, the 800-900 square foot floorplans dropped from 53% to 6%. For densifying markets, this seems to be a size range that works well for both developers and renters (VI. Floorplan Size Substitution in High-Cost Markets).
Looking Forward: Will the Shrinking Continue?
As moderate-cost markets continue to look more like high cost markets, it will be interesting to observe whether they experience a similar trajectory to what has transposed in high-cost markets over the past decade. Additionally, it will be interesting to discern the COVID-19 economic impact on recently built units, as well as the design impact on apartments delivering within the next few years.
- Will the claustrophobia of quarantine and necessity of maintaining distance from others incentivize a meaningful trend towards larger apartment floorplans?
- Rather than changing floorplan sizes, will developers tweak apartment unit mixes to accommodate more time spent at home (for example, more 1BR+ units with designated home office space, but not with more space than a similar 1BR)?
- Will the mismatch between small units delivered in recent years and new consumer preferences for more space continue to drive down recently built apartment rents?
- Will the desire for incremental space at an attainable price, paired with more workplace flexibility, spur a lasting suburban apartment boom?
RCLCO hypothesizes that the increased ability to work from anywhere may encourage some near-term migration away from large city-centers and relocations to less-dense communities, temporarily abating some trends toward smaller unit sizes. Similarly, as new developments incorporate live-work-friendly units into their designs, average unit size may increase in some cases. However, in the long-term, rising building costs and the pressure to deliver attainably-priced units in major metros will continue to drive down sizes in high- and moderate-cost markets over the next decade.
Article and research prepared by Erin Talkington, Managing Director; Dana Schoewe, Senior Associate; and Alden Kramer, Intern
Data Source: RealPage/Axiometrics
Disclaimer: Reasonable efforts have been made to ensure that the data contained in this Advisory reflect accurate and timely information, and the data is believed to be reliable and comprehensive. The Advisory is based on estimates, assumptions, and other information developed by RCLCO from its independent research effort and general knowledge of the industry. This Advisory contains opinions that represent our view of reasonable expectations at this particular time, but our opinions are not offered as predictions or assurances that particular events will occur.
Related Articles


Speak to One of Our Real Estate Advisors Today
We take a strategic, data-driven approach to solving your real estate problems.
Contact Us