
May 1, 2025
Originally published via IREI
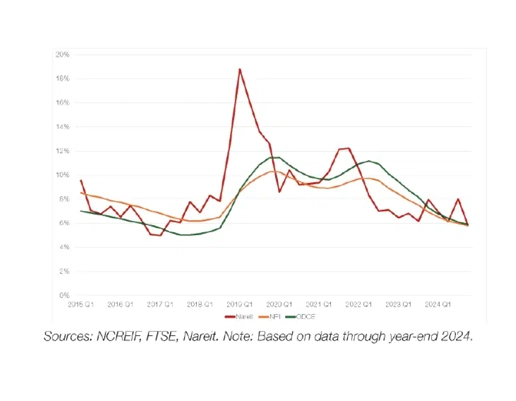
Somewhat coincidentally — but also possibly a telling data point — total returns for public and private real estate benchmarks — FTSE Nareit All Equity REITs Index (FNER), NCREIF Property Index (NPI) and NCREIF Fund Index – Open-end Diversified Core Equity (NFI-ODCE) — were virtually identical over the past decade. Annual average gross returns for the three major U.S. real estate benchmarks were all between 5.7 percent and 5.9 percent for the 10 years ending in fourth quarter 2024.
All of these returns are below their long-term averages but are respectable considering that the past 10 years included significant disruption due to COVID (many retail centers and office buildings were closed for an extended period) and the resetting of both short- and long-term interest rates. Germane to real estate values, the yield on the U.S. 10-year Treasury (UST) note went from 2.3 percent to 4.3 percent over that time. Still, public and private real estate returns exceeded the average 10-year UST by ~350 basis points over that time frame.
Also, the performance of NFI-ODCE and NPI was surprisingly strong given the high weighting to office and low exposure to better-performing niche properties over that time.
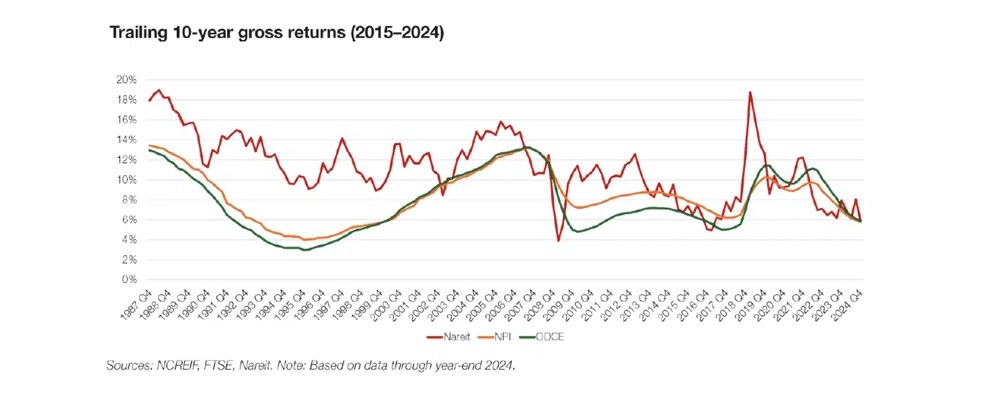
One question that arises is whether the 10-year returns at one point in time are consistent with other time frames. Over the past 10 years, the answer is generally yes (see “Trailing 10-year gross returns (2015–2024),” ). The FTSE Nareit All Equity REIT Index spike in 2019 was due to a few good quarters at the same time that the big negative returns from the global financial crisis were rolling off. Except for that brief period, the trailing long-term returns track closely.
Other factors to consider
The total picture on returns is more nuanced than only the results discussed above. Importantly, publicly traded real estate has outperformed private real estate over longer time periods. During the past 30 years, public returns are 120 basis points to 160 basis points higher on an annual basis. Interestingly, returns are closer over the past 20 years, with NPI and Nareit both returning 7.1 percent before fees, with NFI-ODCE slightly lower at 6.5 percent.
Volatility is another differentiating factor. Over almost all measurement periods, quarterly Nareit returns are more volatile than private-based returns. We note that this divergence is due in large part to the different valuation methods (appraisals versus open market pricing). Another factor is different leverage levels. REITs currently utilize net leverage of approximately 35 percent, while NFI-ODCE leverage is 28 percent, and NPI is an unleveraged index.
There are also significant fee differences, with private real estate fees typically higher than fees for managing REIT portfolios. During the past year, the average fee for the NFI-ODCE index was 84 basis points, while CEM reports average fees of 49 basis points for actively managed REIT separate accounts. At the extreme, investors can access the FTSE Nareit All Equity REIT Index for approximately 10 basis points.
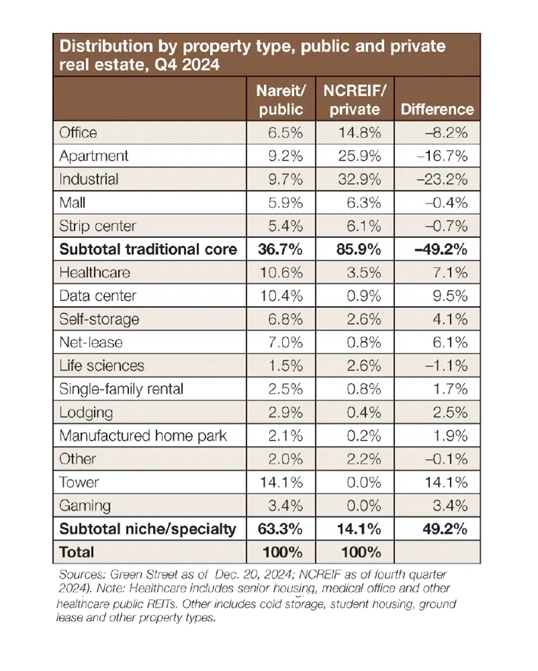
Even though returns have been comparable during the past 10 years, current valuations differ meaningfully between the public and private markets. The trailing-year income returns are 4.8 percent for NPI and 4.1 percent for NFI-ODCE, while the market implied cap rate on the next 12 months, projected income was 6.0 percent (all numbers at the end of 2024). Differences in property type composition (see “Distribution by property type, public and private real estate, Q4 2024,” below right) account for some of this differential, but it does appear that private indices, particularly NFI-ODCE, may be affected by appraisal lag. One implication is that public real estate markets are better positioned to produce higher future returns.
There are also big differences in the property type composition to consider. Private market indices are heavily weighted to traditional property types (office, apartment, industrial and retail), with those sectors making up 86 percent of the NPI. REITs, on the other hand, have only a 37 percent weight to traditional property types, while large specialty/niche sectors including towers (14 percent), healthcare (11 percent) and data centers (10 percent) account for much of the big exposure to specialty/niche sectors. Many institutional investors are endeavoring to increase exposure to niche/specialty sectors, as many of those sectors are believed to offer better risk-adjusted returns on a go-forward basis.
Property sectors have generally performed similarly over the past 10 years in both the public and private markets. Industrial and self-storage were the leading property types for both, while office and retail were both underperformers. In terms of attribution, private real estate’s large overweight to industrial (currently 33 percent versus 10 percent for REITs) was a big driver of overall returns, while REITs’ outsize exposure to data centers (10 percent versus 1 percent) drove overall REIT returns. The other two big differences between public and private indices — towers for REITs (14 percent overweight) and apartments (17 percent overweight) for private real estate — had returns that were similar to all-property averages and thus had much less attribution impact. And while NPI’s current office overweight of 8 percent does not seem that extreme, the share of office in the NPI averaged 27 percent during the past 10 years (versus 15 percent currently). This generated a meaningfully negative allocation impact.
Conclusion
For the past 10 and 20 years, public and private real estate returns have been virtually identical on a gross basis. On a net basis, public returns have been superior to private real estate returns due to lower asset management fees. Public real estate also provides much better liquidity than private real estate. Public REITs are more volatile than private real estate indices, due mainly to different valuation methods. The underlying real estate probably has similar volatility regardless of the ownership structure, although month-end and quarter-end valuation swings can affect reported results and possibly staff bonus calculations.
Private real estate can be accessed in multiple ways, which can affect factors such as fee levels, liquidity and control. The main ways to own core real estate similar to the assets in the NPI and NFI-ODCE indices are through NFI-ODCE funds and through separately managed accounts. Closed-end funds also can own core real estate, but most of those funds focus on higher-returning strategies.
For smaller institutions, a combination of open-end funds and REITs provides the best exposure to real estate’s main attributes: predictable income returns with low correlation to most other asset classes. Closed-end funds can be added to generate higher returns/alpha to the extent that required returns exceed expected core returns.
Institutions with sufficient size often utilize separately managed accounts in order to have the greatest control over major investment decisions such as buying, selling and financing. Separate accounts also allow for higher targeted returns through development, redevelopment or greater leverage. That said, there are some property types that are much easier to access in the public markets than in the private markets, and institutions should take advantage of this through so-called completion strategies that invest in specialty/niche property type REITs.


