March 22, 2023
Introduction
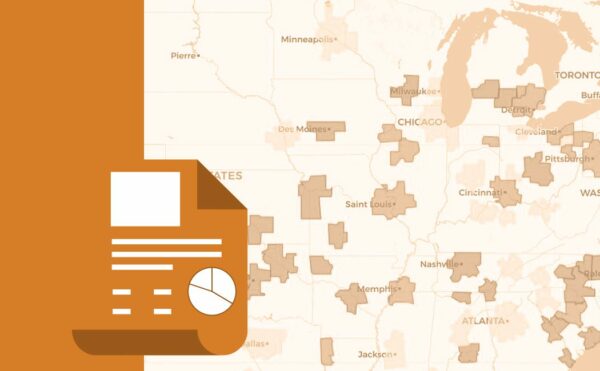
In 2016, RCLCO unveiled a new framework for thinking about local housing markets. Created in conjunction with the ULI Terwilliger Center for Housing, this framework initially examined the 50 largest metropolitan areas to classify each of their suburbs into one of five categories. Two years later, RCLCO expanded its analysis to cover six different types of urban neighborhoods as well.
Since its creation in December 2016, the resulting Neighborhood Atlas has served as a tool for real estate practitioners, academic figures, policy analysts, and others to examine the communities in which they live, work, and play. Importantly, the classifications are just a single snapshot of these communities. In reality, neighborhoods are constantly evolving, as they experience such changes as urbanization, suburbanization, gentrification, and—in some cases—deterioration. The methodology behind the Neighborhood Atlas is described below.
Initial Classifications
First, RCLCO developed a methodology to broadly categorize geographies in almost 150 of the largest metropolitan statistical areas (MSAs) as urban, suburban, or rural/other at the census-tract level. Using this framework, RCLCO delineated the census tracts into more specific categories. Urban categories included high-density urban, urban, and low-density urban. Suburban categories included high-density suburban, suburban, and low-density suburban. Other categories included low-density commercial/institutional/park and rural.
To account for regional differences in development patterns and densities, RCLCO classified metropolitan areas into one of five categories—Gateway, Sun Belt, New West, Heartland, and Legacy—with a sixth and separate category for New York, which has a unique urban fabric and is nearly twice as dense as the next densest metropolitan area. These categories provide a localized view of urbanity to reflect that certain regions are more likely to follow similar development patterns than are others. In other words, the methodology assumes that a metropolitan area like Columbus, Ohio, is more likely to exhibit patterns similar to Indianapolis than it is to San Francisco. When observing development patterns and densities within these categories, RCLCO relied on those of the 50 largest metropolitan areas as a baseline. This distinction reflects that what is considered “urban” in a smaller metropolitan area like Fayetteville, North Carolina, is unlikely to have an impact on what is considered “urban” in a more densely populated metropolitan area within the same region, like Atlanta, Georgia.
As part of the analysis, RCLCO combined and added MSAs to reflect the practical and geographic boundaries of metropolitan areas, as defined by their regional economies and housing markets. For example, RCLCO analyzed San Francisco and San Jose together, just as it did for Los Angeles and Riverside. In addition, RCLCO considered smaller MSAs alongside larger ones with which they interact. When determining the 50 largest metropolitan areas, RCLCO thus included the following smaller MSAs that would not have otherwise met this threshold: Worcester (overlaps with Boston); Akron (overlaps with Cleveland); Boulder and Greeley (overlap with Denver); Oxnard (overlaps with Los Angeles); Bridgeport (overlaps with New York); The Villages (overlaps with Orlando); Durham (overlaps with Raleigh); Ogden and Provo (overlap with Salt Lake City); Napa, Santa Rosa, and Vallejo (overlap with San Francisco); and Bremerton and Olympia (overlap with Seattle). While RCLCO used these additional MSAs for the purpose of determining the relative densities of census tracts in the 50 largest metropolitan areas, it did not include these other MSAs when calculating the economic and demographic trends seen in the “Top 50 MSAs.”
Please see below for more information on the MSAs used in this analysis:
MSA Categories
| MSA | CATEGORY | METROPOLITAN AREA | TYPE | TOP 50 METROPOLITAN AREAS |
| New York-Newark-Jersey City, NY-NJ-PA | New York | New York, NY | Primary | Yes |
| Bridgeport-Stamford-Norwalk, CT | New York | New York, NY | Secondary | Yes |
| Boston-Cambridge-Newton, MA-NH | Gateway | Boston, MA | Primary | Yes |
| Worcester, MA-CT | Gateway | Boston, MA | Secondary | Yes |
| Chicago-Naperville-Elgin, IL-IN-WI | Gateway | Chicago, IL | Primary | Yes |
| Los Angeles-Long Beach-Anaheim, CA | Gateway | Los Angeles, CA | Primary | Yes |
| Oxnard-Thousand Oaks-Ventura, CA | Gateway | Los Angeles, CA | Secondary | Yes |
| Riverside-San Bernardino-Ontario, CA | Gateway | Los Angeles, CA | Secondary | Yes |
| Miami-Fort Lauderdale-Pompano Beach, FL | Gateway | Miami, FL | Primary | Yes |
| Philadelphia-Camden-Wilmington, PA-NJ-DE-MD | Gateway | Philadelphia, PA | Primary | Yes |
| San Francisco-Oakland-Berkeley, CA | Gateway | San Francisco/San Jose, CA | Primary | Yes |
| Napa, CA | Gateway | San Francisco/San Jose, CA | Secondary | Yes |
| San Jose-Sunnyvale-Santa Clara, CA | Gateway | San Francisco/San Jose, CA | Secondary | Yes |
| Santa Rosa-Petaluma, CA | Gateway | San Francisco/San Jose, CA | Secondary | Yes |
| Vallejo, CA | Gateway | San Francisco/San Jose, CA | Secondary | Yes |
| Washington-Arlington-Alexandria, DC-VA-MD-WV | Gateway | Washington, D.C. | Primary | Yes |
| Atlanta-Sandy Springs-Alpharetta, GA | Sun Belt | Atlanta, GA | Primary | Yes |
| Austin-Round Rock-Georgetown, TX | Sun Belt | Austin, TX | Primary | Yes |
| Birmingham-Hoover, AL | Sun Belt | Birmingham, AL | Primary | Yes |
| Charlotte-Concord-Gastonia, NC-SC | Sun Belt | Charlotte, NC | Primary | Yes |
| Dallas-Fort Worth-Arlington, TX | Sun Belt | Dallas, TX | Primary | Yes |
| Houston-The Woodlands-Sugar Land, TX | Sun Belt | Houston, TX | Primary | Yes |
| Jacksonville, FL | Sun Belt | Jacksonville, FL | Primary | Yes |
| Nashville-Davidson–Murfreesboro–Franklin, TN | Sun Belt | Nashville, TN | Primary | Yes |
| New Orleans-Metairie, LA | Sun Belt | New Orleans, LA | Primary | Yes |
| Orlando-Kissimmee-Sanford, FL | Sun Belt | Orlando, FL | Primary | Yes |
| The Villages, FL | Sun Belt | Orlando, FL | Secondary | Yes |
| Phoenix-Mesa-Chandler, AZ | Sun Belt | Phoenix, AZ | Primary | Yes |
| Raleigh-Cary, NC | Sun Belt | Raleigh/Durham, NC | Primary | Yes |
| Durham-Chapel Hill, NC | Sun Belt | Raleigh/Durham, NC | Secondary | Yes |
| Richmond, VA | Sun Belt | Richmond, VA | Primary | Yes |
| San Antonio-New Braunfels, TX | Sun Belt | San Antonio, TX | Primary | Yes |
| Tampa-St. Petersburg-Clearwater, FL | Sun Belt | Tampa, FL | Primary | Yes |
| Virginia Beach-Norfolk-Newport News, VA-NC | Sun Belt | Virginia Beach, VA | Primary | Yes |
| Albuquerque, NM | Sun Belt | Albuquerque, NM | Primary | No |
| Asheville, NC | Sun Belt | Asheville, NC | Primary | No |
| Baton Rouge, LA | Sun Belt | Baton Rouge, LA | Primary | No |
| Charleston-North Charleston, SC | Sun Belt | Charleston, SC | Primary | No |
| Charlottesville, VA | Sun Belt | Charlottesville, VA | Primary | No |
| Chattanooga, TN-GA | Sun Belt | Chattanooga, TN | Primary | No |
| Columbia, SC | Sun Belt | Columbia, SC | Primary | No |
| Corpus Christi, TX | Sun Belt | Corpus Christi, TX | Primary | No |
| Deltona-Daytona Beach-Ormond Beach, FL | Sun Belt | Daytona Beach, FL | Primary | No |
| El Paso, TX | Sun Belt | El Paso, TX | Primary | No |
| Fayetteville-Springdale-Rogers, AR | Sun Belt | Fayetteville, AR | Primary | No |
| Fayetteville, NC | Sun Belt | Fayetteville, NC | Primary | No |
| Cape Coral-Fort Myers, FL | Sun Belt | Fort Myers, FL | Primary | No |
| Punta Gorda, FL | Sun Belt | Fort Myers, FL | Secondary | No |
| Gainesville, FL | Sun Belt | Gainesville, FL | Primary | No |
| Greensboro-High Point, NC | Sun Belt | Greensboro, NC | Primary | No |
| Greenville-Anderson, SC | Sun Belt | Greenville, SC | Primary | No |
| Huntsville, AL | Sun Belt | Huntsville, AL | Primary | No |
| Jackson, MS | Sun Belt | Jackson, MS | Primary | No |
| Knoxville, TN | Sun Belt | Knoxville, TN | Primary | No |
| Lakeland-Winter Haven, FL | Sun Belt | Lakeland, FL | Primary | No |
| Myrtle Beach-Conway-North Myrtle Beach, SC-NC | Sun Belt | Myrtle Beach, FL | Primary | No |
| Naples-Marco Island, FL | Sun Belt | Naples, FL | Primary | No |
| Ocala, FL | Sun Belt | Ocala, FL | Primary | No |
| Palm Bay-Melbourne-Titusville, FL | Sun Belt | Palm Bay/Melbourne, FL | Primary | No |
| Sebastian-Vero Beach, FL | Sun Belt | Palm Bay/Melbourne, FL | Secondary | No |
| Port St. Lucie, FL | Sun Belt | Port St. Lucie, FL | Primary | No |
| Santa Fe, NM | Sun Belt | Santa Fe, NM | Primary | No |
| North Port-Sarasota-Bradenton, FL | Sun Belt | Sarasota, FL | Primary | No |
| Savannah, GA | Sun Belt | Savannah, GA | Primary | No |
| Hilton Head Island-Bluffton, SC | Sun Belt | Savannah, GA | Secondary | No |
| Tallahassee, FL | Sun Belt | Tallahassee, FL | Primary | No |
| Tucson, AZ | Sun Belt | Tucson, AZ | Primary | No |
| Waco, TX | Sun Belt | Waco, TX | Primary | No |
| Wilmington, NC | Sun Belt | Wilmington, NC | Primary | No |
| Winston-Salem, NC | Sun Belt | Winston-Salem, NC | Primary | No |
| Denver-Aurora-Lakewood, CO | New West | Denver, CO | Primary | Yes |
| Boulder, CO | New West | Denver, CO | Secondary | Yes |
| Greeley, CO | New West | Denver, CO | Secondary | Yes |
| Las Vegas-Henderson-Paradise, NV | New West | Las Vegas, NV | Primary | Yes |
| Portland-Vancouver-Hillsboro, OR-WA | New West | Portland, OR | Primary | Yes |
| Sacramento-Roseville-Folsom, CA | New West | Sacramento, CA | Primary | Yes |
| Salt Lake City, UT | New West | Salt Lake City, UT | Primary | Yes |
| Ogden-Clearfield, UT | New West | Salt Lake City, UT | Secondary | Yes |
| Provo-Orem, UT | New West | Salt Lake City, UT | Secondary | Yes |
| San Diego-Chula Vista-Carlsbad, CA | New West | San Diego, CA | Primary | Yes |
| Seattle-Tacoma-Bellevue, WA | New West | Seattle, WA | Primary | Yes |
| Bremerton-Silverdale-Port Orchard, WA | New West | Seattle, WA | Secondary | Yes |
| Olympia-Lacey-Tumwater, WA | New West | Seattle, WA | Secondary | Yes |
| Bakersfield, CA | New West | Bakersfield, CA | Primary | No |
| Bend, OR | New West | Bend, OR | Primary | No |
| Boise City, ID | New West | Boise, ID | Primary | No |
| Colorado Springs, CO | New West | Colorado Springs, CO | Primary | No |
| Eugene-Springfield, OR | New West | Eugene, OR | Primary | No |
| Fresno, CA | New West | Fresno, CA | Primary | No |
| Urban Honolulu, HI | New West | Honolulu, HI | Primary | No |
| Reno, NV | New West | Reno, NV | Secondary | No |
| Carson City, NV | New West | Reno, NV | Secondary | No |
| Salem, OR | New West | Salem, OR | Primary | No |
| Salinas, CA | New West | Salinas, CA | Primary | No |
| Santa Cruz-Watsonville, CA | New West | Santa Cruz, CA | Primary | No |
| Santa Maria-Santa Barbara, CA | New West | Santa Maria/Santa Barbara, CA | Primary | No |
| San Luis Obispo-Paso Robles, CA | New West | Santa Maria/Santa Barbara, CA | Secondary | No |
| Spokane-Spokane Valley, WA | New West | Spokane, WA | Primary | No |
| Stockton, CA | New West | Stockton, CA | Primary | No |
| Cincinnati, OH-KY-IN | Heartland | Cincinnati, OH | Primary | Yes |
| Columbus, OH | Heartland | Columbus, OH | Primary | Yes |
| Indianapolis-Carmel-Anderson, IN | Heartland | Indianapolis, IN | Primary | Yes |
| Kansas City, MO-KS | Heartland | Kansas City, MO | Primary | Yes |
| Louisville/Jefferson County, KY-IN | Heartland | Louisville, KY | Primary | Yes |
| Memphis, TN-MS-AR | Heartland | Memphis, TN | Primary | Yes |
| Minneapolis-St. Paul-Bloomington, MN-WI | Heartland | Minneapolis, MN | Primary | Yes |
| Oklahoma City, OK | Heartland | Oklahoma City, OK | Primary | Yes |
| St. Louis, MO-IL | Heartland | St. Louis, MO | Primary | Yes |
| Ann Arbor, MI | Heartland | Ann Arbor, MI | Primary | No |
| Des Moines-West Des Moines, IA | Heartland | Des Moines, IA | Primary | No |
| Lafayette-West Lafayette, IN | Heartland | Lafayette, IN | Primary | No |
| Lincoln, NE | Heartland | Lincoln, NE | Primary | No |
| Little Rock-North Little Rock-Conway, AR | Heartland | Little Rock, AR | Primary | No |
| Madison, WI | Heartland | Madison, WI | Primary | No |
| Omaha-Council Bluffs, NE-IA | Heartland | Omaha, NE | Primary | No |
| Tulsa, OK | Heartland | Tulsa, OK | Primary | No |
| Wichita, KS | Heartland | Wichita, KS | Primary | No |
| Baltimore-Columbia-Towson, MD | Legacy | Baltimore, MD | Primary | Yes |
| Buffalo-Cheektowaga, NY | Legacy | Buffalo, NY | Primary | Yes |
| Cleveland-Elyria, OH | Legacy | Cleveland, OH | Primary | Yes |
| Akron, OH | Legacy | Cleveland, OH | Secondary | Yes |
| Detroit-Warren-Dearborn, MI | Legacy | Detroit, MI | Primary | Yes |
| Grand Rapids-Kentwood, MI | Legacy | Grand Rapids, MI | Primary | Yes |
| Hartford-East Hartford-Middletown, CT | Legacy | Hartford, CT | Primary | Yes |
| Milwaukee-Waukesha, WI | Legacy | Milwaukee, WI | Primary | Yes |
| Pittsburgh, PA | Legacy | Pittsburgh, PA | Primary | Yes |
| Providence-Warwick, RI-MA | Legacy | Providence, RI | Primary | Yes |
| Rochester, NY | Legacy | Rochester, NY | Primary | Yes |
| Albany-Schenectady-Troy, NY | Legacy | Albany, NY | Primary | No |
| Dayton-Kettering, OH | Legacy | Dayton, OH | Primary | No |
| Fort Wayne, IN | Legacy | Fort Wayne, IN | Primary | No |
| Green Bay, WI | Legacy | Green Bay, WI | Primary | No |
| Lansing-East Lansing, MI | Legacy | Lansing, MI | Primary | No |
| New Haven-Milford, CT | Legacy | New Haven, CT | Primary | No |
| Norwich-New London, CT | Legacy | Norwich, CT | Primary | No |
| Portland-South Portland, ME | Legacy | Portland, ME | Primary | No |
| South Bend-Mishawaka, IN-MI | Legacy | South Bend, IN | Primary | No |
| Syracuse, NY | Legacy | Syracuse, NY | Primary | No |
| Toledo, OH | Legacy | Toledo, OH | Primary | No |
| Trenton-Princeton, NJ | Legacy | Trenton, NJ | Primary | No |
Source: RCLCO
Before distinguishing between metropolitan area categories, RCLCO first identified census tracts without any housing units as nonresidential, classifying them as Low-Density Commercial/Institutional/Park based on the areas in which they appeared. Next, RCLCO examined population and employment densities, using whichever metric was higher, to identify and separate the geographies that function as downtowns or rural areas. RCLCO labeled tracts with more than 25,000 jobs or residents per square mile as high-density urban and tracts with fewer than 100 jobs or residents per square mile as Rural. After these initial cuts, RCLCO then classified any tracts with more than 100 jobs or residents per square mile, but fewer than 250 housing units overall, as Low-Density Commercial/Institutional/Park in order to account for universities, ports, and other institutions that have high population or employment densities but minimal housing. Again, RCLCO applied these categories consistently across all metropolitan area categories.
For the remaining tracts, RCLCO used a standard deviation methodology to determine relative densities and value dynamics within the MSAs. Using the above metropolitan area categories, RCLCO examined the remaining tracts based on:
- Population or employment densities, again considering whichever density was higher.
- High-density
- 0+ standard deviations from the mean for residential tracts
- 0.5+ standard deviations from the mean for employment tracts
- Medium-density
- −0.5 to 0 standard deviations from the mean for residential tracts
- −0.5 to 0.5 standard deviations from the mean for employment tracts
- Low-density
- Less than −0.5 standard deviations from the mean for both residential and employment tracts
- High-density
- Percentage of housing units that are in single-family detached homes
- Within high-density
- Tracts with less than 10 percent single-family detached were classified as urban.
- Within medium-density
- Tracts with more than 30 percent single-family detached were classified as suburban.
- Within low-density
- Tracts with more than 30 percent single-family detached were classified as low-density suburban.
- Tracts with less than 30 percent single-family detached were classified as Low-Density Commercial/Institutional/Park, after RCLCO observed where this classification was occurring (airports, military institutions, regional parks, etc.).
- For high-density tracts with more than 10 percent single-family detached and medium-density tracts with less than 30 percent single-family detached, density and housing type alone did not provide enough differentiation to determine whether tracts were more urban or more suburban. RCLCO therefore analyzed these tracts based on distance from the city center and whether they were primarily residential or commercial.
- For these areas, all tracts less than five miles from the city center were classified as low-density urban;
- Employment-driven tracts between five and ten miles from the city center were classified as low-density urban, and residential-driven ones were classified as high-density suburban; and
- All tracts more than ten miles from the city center were classified as high-density suburban.
- For metropolitan areas that did not fall within the 50 largest MSAs, RCLCO then re-classified a handful of low-density urban tracts as high-density suburban, given that the larger sizes of census tracts in smaller metropolitan areas made it difficult to reflect their density.
- In these MSAs, tracts with population densities that were 1.0+ standard deviations above the mean remained classified as low-density urban;
- Tracts with population densities that were 0.25+ standard deviations above the mean and employment densities that were also 0+ standard deviations above the mean remained classified as low-density urban; and
- Other census tracts were re-classified as high-density suburban.
- Within high-density
This classification system resulted in six key categories of residential places within regions:
- High-Density Urban: Downtowns and outer employment cores
- Urban: Dense in-town neighborhoods and outer employment corridors
- Low-Density Urban: Relatively dense, in-town residential neighborhoods
- High-Density Suburban: Relatively dense outer neighborhoods and commercial corridors
- Suburban: Well-populated neighborhoods where most of the housing stock consists of single-family detached homes
- Low-Density Suburban: Neighborhoods where most of the housing stock consists of single-family detached homes, and some land is undeveloped.
Please see the below infographic for a summary of this methodology:
Initial Classification Methodology

Source: RCLCO
Application to Urban Neighborhoods
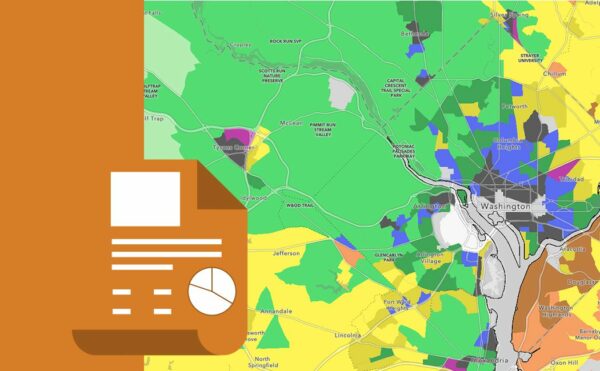
Using these categories, RCLCO then selected the high-density urban, urban, and low-density urban tracts as areas to consider “urban” for the purpose of this analysis. To further characterize urban areas relative to their likely current and future development potential, RCLCO outlined six paradigms to incorporate the impact of land value and availability on development trends:
- Economic Center: These locations offer significant concentrations of employment and are often the historic urban cores of the cities in which they are located. While office buildings typically outnumber residential buildings in these areas, new multifamily and mixed-use development is starting to bring a mix of uses to many of the nine-to-five neighborhoods they comprise.
- Emerging Economic Center: Once characterized by single-family residential or low-density commercial land uses, these locations are rapidly emerging as new urban cores. These places are generally well-located but underutilized, and they tend to offer more opportunities for ground-up development than other, more established urban locations.
- Mixed-Use District: Often situated near major employment cores, these locations tend to be more residentially focused, typically with high-density housing and upscale retail. While these places once attracted a large share of new development, construction has moderated in recent years as land availability has declined.
- High-End Neighborhood: These areas are comprised of in-town residential neighborhoods with high home values and apartment rents and convenient access to shops and restaurants. Typically characterized by single-family development, these locations are often lower density and more historic than other, more conventionally urban neighborhoods.
- Middle-Income Neighborhood: These historically working-class neighborhoods feature diverse housing types that are attainable to a broad range of households, making them attractive to households looking for a price alternative to more expensive or established urban locations, given their older and often more affordable housing inventories. In many regions, these areas are therefore beginning to confront issues of gentrification.
- Challenged Neighborhood: These locations have significantly lower home values and apartment rents than other urban neighborhoods, along with aging infrastructure and minimal new development. As a result, these areas tend to be less attractive to households that can afford to live elsewhere, resulting in very high vacancy and unemployment rates.
Please see the below infographic for more information on the methodology used to distinguish between these urban neighborhoods:
Detailed Urban Classification Methodology

Source: RCLCO
Application to Suburban Neighborhoods
RCLCO also selected the high-density suburban, suburban, and low-density suburban tracts as areas to consider “suburban” for the purpose of this analysis. To further characterize suburban areas relative to their likely current and future development potential, RCLCO outlined five suburban paradigms to incorporate the impact of land value and availability on development trends:
- Established High-End Suburb: These locations have high home values and established development patterns that likely offer the best opportunities for market-based development, but also tend to have strident community objection to new growth. When new homes or communities are built in these areas, they are often at higher densities or price points than surrounding neighborhoods.
- Middle-Income Suburb: These locations have a wide range of home values attainable to a broad range of households in the region, often located in close-in areas where most of the housing was built decades ago. Some evidence indicates that these areas are becoming increasingly scarce because these suburbs are either gentrifying into higher-end suburbs or deteriorating into economically challenged areas.
- Economically Challenged Suburbs: These locations have lower home values and little to no population growth in recent years. In many cases, these areas have aging infrastructure or underperforming city services that make them less attractive for new market-rate development.
- Greenfield Lifestyle Suburbs: These locations are at or close to the suburban fringe of established high-end suburbs, where the bulk of new community development is occurring. They have mostly developed over the past 10–15 years and likely have some land still available for new development.
- Greenfield Value Suburbs: These locations are at or close to the suburban fringe of stable or economically challenged areas; they have attracted new value-oriented communities that offer attractive home prices for many households. These areas have been developing over the past 10 to 15 years and sometimes reflect a “drive until you qualify” pattern.
Please see the below infographic for more information on the methodology used to distinguish between these suburban neighborhoods:
Detailed Suburban Classification Methodology

Source: RCLCO
RCLCO then defined Greenfield neighborhoods with home values 0.25 standard deviations above metropolitan area averages as “Greenfield Lifestyle,” and ones with home values below this threshold as “Greenfield Value.”
Article and research prepared by Erin Talkington, Managing Director and Jake Ross, Principal.
Disclaimer: Reasonable efforts have been made to ensure that the data contained in this Advisory reflect accurate and timely information, and the data is believed to be reliable and comprehensive. The Advisory is based on estimates, assumptions, and other information developed by RCLCO from its independent research effort and general knowledge of the industry. This Advisory contains opinions that represent our view of reasonable expectations at this particular time, but our opinions are not offered as predictions or assurances that particular events will occur.