The Impact of Mobility on Apartment Rents

Location, location, location…the real estate industry knows the importance yet is only beginning to quantify the different aspects that help distinguish an “A” location and understand how they can unlock and leverage a property’s competitiveness. An important shift in how the real estate industry understands location and evaluates sites is the concept of mobility – the combination of proximity, accessibility, and available transportation options – and it’s also one of the easiest factors a property owner can improve on-site. Harnessing the power of big data and analytics, RCLCO collaborated with TransitScreen to quantify the impact of mobility and improved mobility, as measured by TransitScreen’s MobilityScore™, on apartment rents in each market and for every location.
Unsurprisingly, increases in mobility (as measured by TransitScreen’s MobilityScore) are related to higher rents for apartments. Among communities built since 2010 across the country, those with Excellent Mobility achieve rents that are 59% higher than average and communities with Good Mobility achieve rents 22% higher than average. Part of this difference is because markets with higher average MobilityScores also tend to be higher cost, but the relationship is not just a New York or Boston phenomenon.
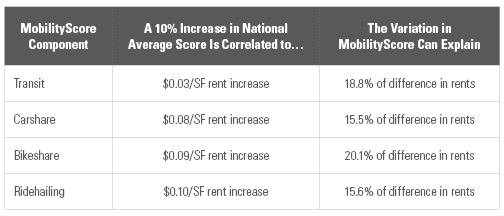
Mobility is more than just public transit; mobility is a suite of options that provide a variety of ways to move around. Nationally, among apartment communities built since 2010, a 10% increase in MobilityScore is correlated with an increase of $0.12 per square foot, and the difference in MobilityScore accounts for 28% of the variation in rent per square foot.[1] Among the four components of mobility quantified by MobilityScore (transit, carshare, bikeshare, ridehailing), we found a 10% increase in each score can have dramatically different results.
While these relationships are interesting at a national level, by analyzing nearly 40,000 apartment communities representing approximately nine million units nationwide, we are able to derive market-specific conclusions in every market and have created interactive tools where you can select your market. Following these interactive tools, we suggest specific improvements real estate developers and operators may consider to improve rents at an apartment community. These improvements, which can be as simple and inexpensive as adding a bikeshare station or dedicating a carshare space in the garage, have real value attached to them that can be quantified on a site-specific basis.
RCLCO is a big fan of data. In the past, we have analyzed and mapped the growth of “micro” units and “macro” units within apartment communities and the shrinking size of new apartments nationally. In this Advisory, we partnered with TransitScreen to analyze the impact of mobility on apartment rents in every market nationwide using MobilityScore—an innovative tool currently in beta testing that scores every location in the United States and parts of Europe based on historical and real time availability and frequency of mass transit, ridehailing, carshare, bikeshare, and other mobility services.
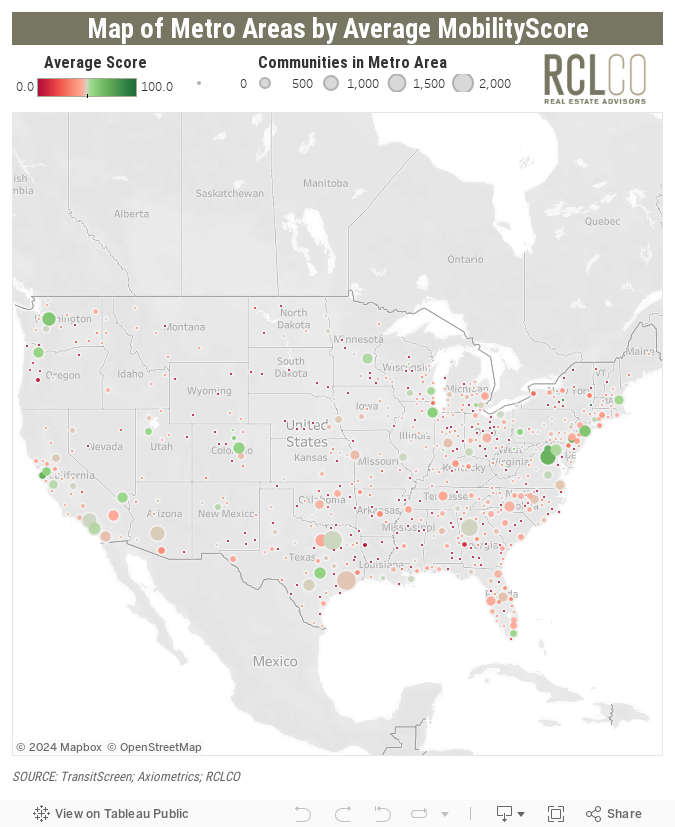
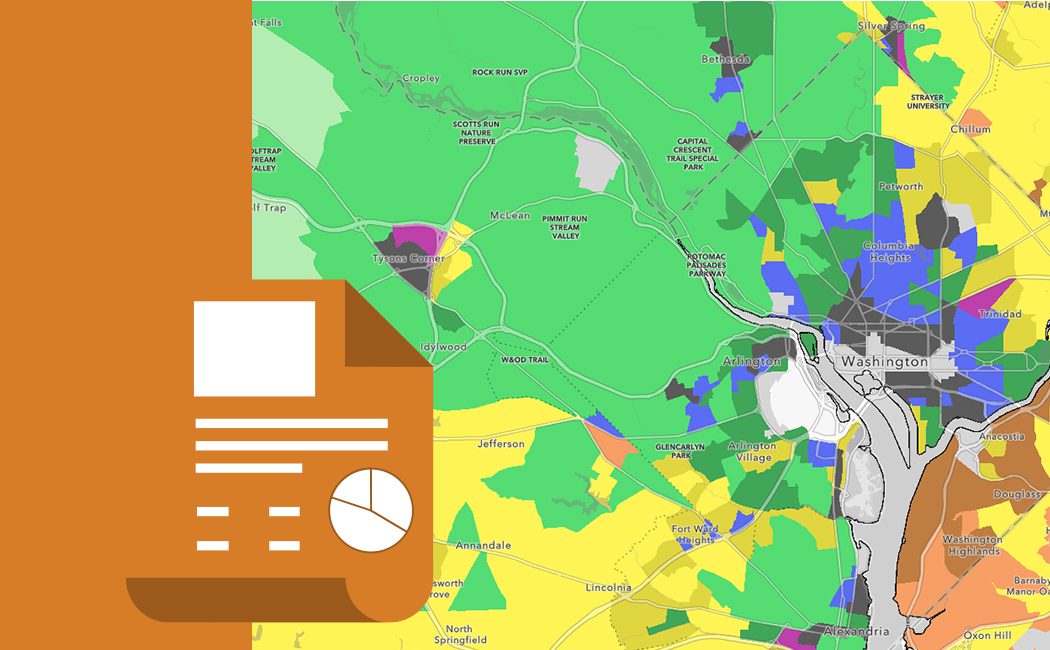
Collaborating with TransitScreen, we analyzed the impact of mobility on rents at nearly 40,000 apartment communities nationwide to determine the impact of mobility on rents. The map below shows the markets we covered in this analysis as well as the average MobilityScore within each metro area.
The MobilityScore Data
TransitScreen, founded in 2013, provides real-time information for a specific location’s availability and access to various transit options. The screens are found in coffee shops, office buildings, and apartment communities across the United States, Canada, and parts of Europe; and show the timing of various mobility options, including bus, streetcar, commuter rail, Amtrak, bikeshare, carshare, ridehailing, and more.
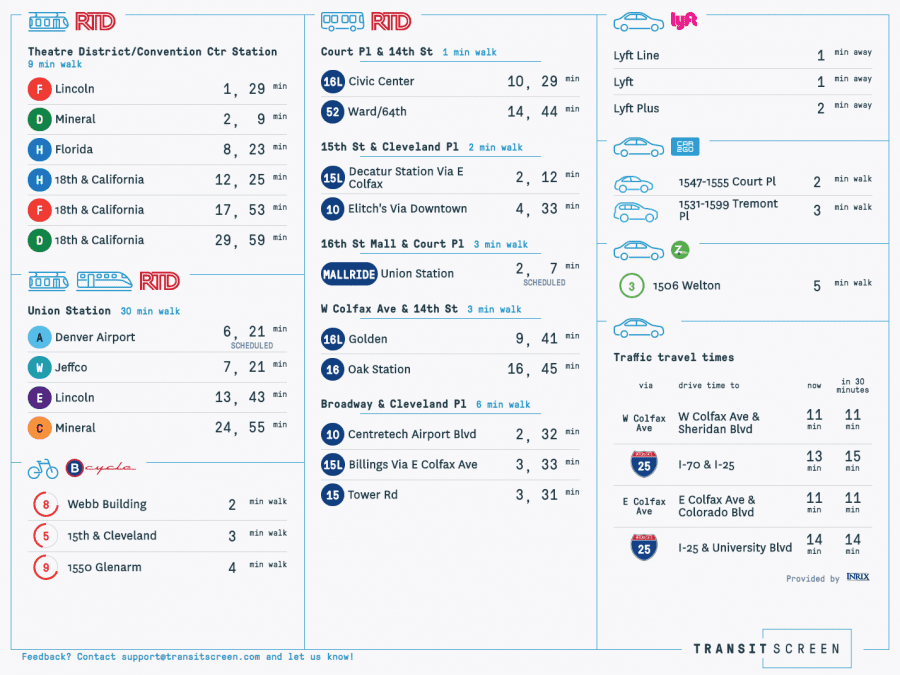
A TransitScreen in Denver, Colorado
In addition to a real-time display of transit information for tenants and visitors, TransitScreen uses this data to create a MobilityScore, which quantifies the usefulness of transit and mobility services for people living and working where the screen is located.
Mobility is not just about proximity to a bus stop or light rail. It includes the availability of bikeshare, ridehailing services (such as Uber and Lyft), carshare services like Car2Go and Zipcar, and the frequency of mass transit. While an apartment community may be next to a bus stop, it is significantly more useful to have service every 10 minutes than a handful of buses during peak hours. The frequency of a mobility service is then weighted by how far you have to walk or wait to access the service. A new streetcar is great, but if the closest stop is over a mile away, it is not useful, and one bus line stopping across the street can be more useful than two bus lines five blocks away. MobilityScore is “mode agnostic”, meaning a bus that arrives every 10 minutes adds just as many points to the score as a streetcar running every 10 minutes.
For mobility services including bikeshare, carshare, and ridehailing, the score is based on how often a service is available within walking distance and how long it takes to access a service. Therefore, the mobility score for a service like Lyft, which is usually available and comes to the user, would influence MobilityScore more than a dockless bikeshare operator if the bikes were, on average, only near a location on weekday afternoons.
After combining the scores of each mobility option, known as “Average Access Units,” the scores are normalized through an exponential function that weights each additional marginal access unit less than the previous access unit. This normalization process is important because it recognizes that adding one extra bus line or bikeshare station to a neighborhood with limited service is much more important than adding the same additional bus line to a neighborhood with dozens of existing mobility options.
MobilityScore starts at zero and each location is categorized as Minimal (less than 40), Fair (40-60), Good (60-80), or Excellent Mobility (80+).
MobilityScore Impact on Apartment Rents
RCLCO analyzed the impact of MobilityScore on rents for nearly 40,000 apartment communities representing approximately nine million units across the United States. Only 5.6% of apartment communities in the sample have Excellent Mobility while 8.2% have Good Mobility, though this varies significantly from one market to another, and newer apartment communities tend to have better mobility.
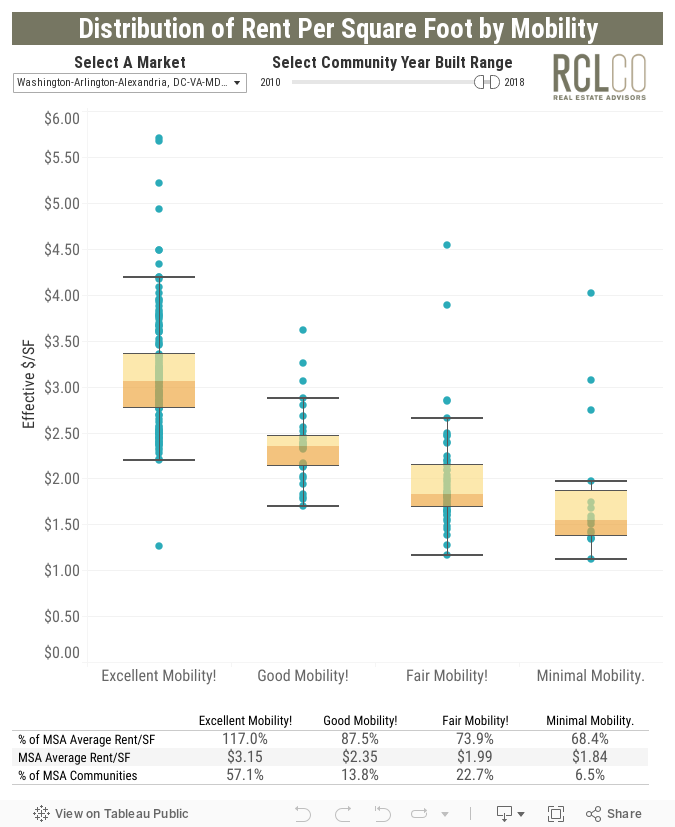
Among newer apartment communities (built from 2010 through the present), those with Excellent Mobility represent 12.3% of communities and achieve rents nearly 60% higher than average while those with Good Mobility represent 14.7% of communities and have rents 22.1% higher than average. While the impact nationally is robust, the magnitude differs significantly from one market to the next.
Select your market in the interactive visualization below to see a distribution of effective rent per square foot of apartment communities in your market by mobility category.[2]
Nationally, a linear regression for MobilityScore versus rent per square foot shows that, at the sample average of 52.7 points, for a 10% increase of MobilityScore, rents increase by $0.12 per square foot. A 10% increase in locations with higher initial MobilityScore would have even higher rent increases.
It is likely that not all of this rent increase for a higher MobilityScore point is due to increased mobility. However, the rent increase per additional MobilityScore can be approximated by multiplying the average increase in rent by the R-Squared value of the linear regression line that explains the relationship between MobilityScore and rent per square foot. With an R-Squared of 0.28 nationally, we attribute $0.04 per square foot of the increased rent to the 10% increase in the national average MobilityScore. While the national relationship is meaningful, the ability to attribute increased rents to increased mobility does vary significantly by market.
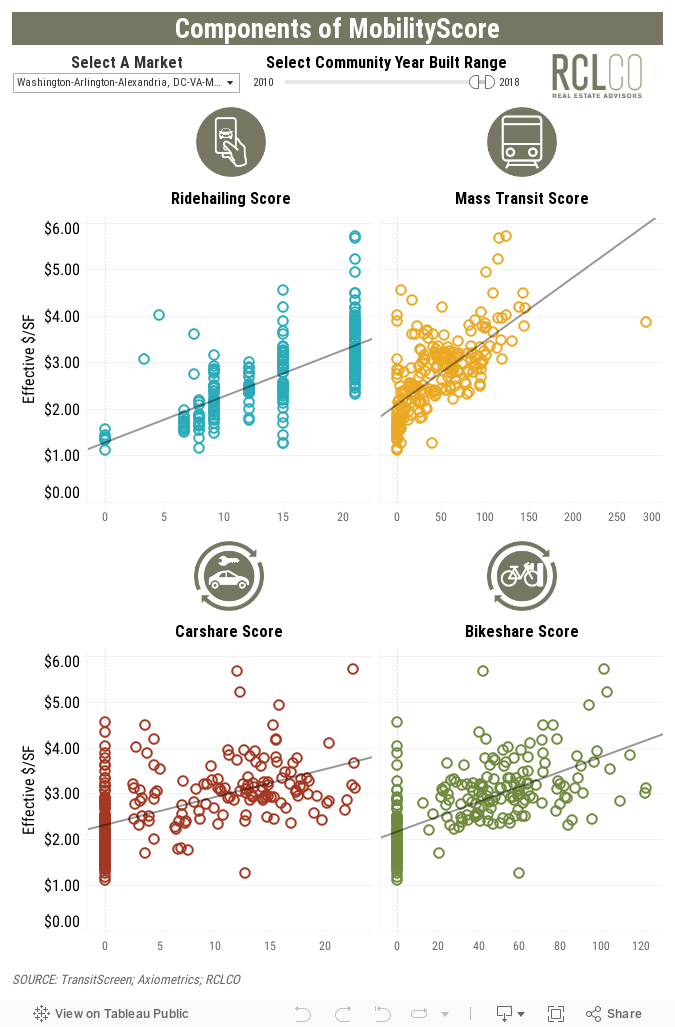
Different Mobility Options Have Different Impacts on Rent
Similar to how different markets have a different response to differences in MobilityScore, the relationship between rent per square foot and each of the component scores (ridehailing, mass transit, carshare, and bikeshare) vary based on the unique context of the local built environment and consumer preferences. In the interactive visualization below, select a market to understand the relationship between each of the four component scores and rent per square foot in the selected market. The data are presented in a series of scatter charts with a linear regression line that shows the impact of each of the component scores on rent per square foot.[3]
Improving MobilityScore for Your Developments
Mobility is primarily dependent on existing location factors and the surrounding built environment. An understanding of the impact of MobilityScore, and especially the components of MobilityScore, on achievable rents at a particular location can be useful in selecting sites for new development. In certain markets such as Boston, quality of public transit is paramount, while in others such as Orange County, CA, there are no meaningful correlations between better transit access and higher rents per square foot.
Luckily, mobility is not just about public transit (trains, buses, etc.), but rather a suite of options and potential improvements, meaning that real estate developers and owners can directly impact their community’s MobilityScore, with the goal of impacting the rents and overall property value.
Depending on the market, different components of mobility influence rents in different ways. For example, in two Pacific Northwest markets, the most statistically significant component to explain rent per square foot in Portland is bikeshare, while in the Seattle market ridehailing has the most robust relationship with rents. In other words, when selecting a development site in Seattle, it is more important to understand the accessibility of ridehailing than bikeshare and the opposite in Portland.
In addition to site selection, developers should plan for mobility improvements as part of their development program to influence mobility options, and enhance their project’s competitive positioning within the local market. Property owners and managers have already started responding to these trends, either by offering the services themselves or by collaborating with other mobility-focused companies and local governments. Options of potential improvements include:
- Electric scooter/bike charging pods
- Dedicated carshare spots
- A new on-premises bikeshare station
- Ridehail services waiting room
- Private transit service to commuter rail or subway
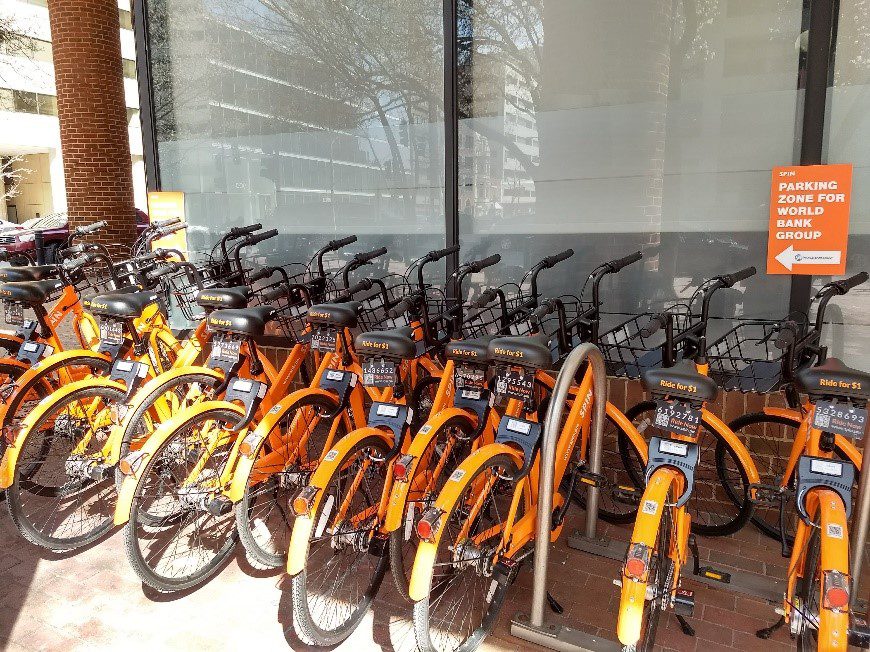
A Dedicated Spin Dockless Bikeshare Pod at the World Bank Group in Washington, DC
Image courtesy Daniel Warwick, RCLCO
While we can generalize the impact of each improvement by market, quantifying the impact at a certain site is more complicated. The impact of each improvement not only varies by market; it varies by submarket, neighborhood, block–even within blocks–and requires hyper-local site and context specific analysis. Each improvement is associated with an increase in MobilityScore that is dependent on the site’s mobility before improvements.
For example, a bikeshare station is more useful where there are no existing bikeshare stations within walking distance than when one already exists five minutes away. Depending on the mobility context and usage of docked bikeshare within a market, the impact of a new station at a particular location could increase MobilityScore by between one and 10 points. In areas where a station already exists adjacent to the site, there would be no impact from adding a new station. The same is true of every other mobility improvement you may consider at your site.
While there are positive relationships between mobility and rents in nearly every market, optimizing mobility for market-driven results (i.e., increased rents) at a particular location requires more granular site-specific understanding of current and potential future mobility options offered outside of the project.
Article and research prepared by Derek Wyatt, Principal, and Daniel Warwick, Technology Associate.
References
[1] Where the score for a community is greater than 0
[2] The data are presented in a series of boxcharts for Excellent, Good, Fair, and Minimal Mobility. The shaded area of each boxchart is the area between the 25th and 75th percentile of rent per square foot of the selected communities by market, year built range, and mobility. The lines at the top and bottom of each box chart are the upper and lower whiskers and indicate the top and bottom distribution of rents that are not outliers.
[3] When hovering over the line on each chart, the equation is the formula for the best-fit linear regression line. A P-value below 0.05 indicates there is a statistical significance to the relationship between the component score and effective rent per square foot. The R-Squared value reflects the degree to which the variation of effective rent per square foot can be explained by differences in the component score.
Disclaimer: Reasonable efforts have been made to ensure that the data contained in this Advisory reflect accurate and timely information, and the data is believed to be reliable and comprehensive. The Advisory is based on estimates, assumptions, and other information developed by RCLCO from its independent research effort and general knowledge of the industry. This Advisory contains opinions that represent our view of reasonable expectations at this particular time, but our opinions are not offered as predictions or assurances that particular events will occur.
Related Articles


Speak to One of Our Real Estate Advisors Today
We take a strategic, data-driven approach to solving your real estate problems.
Contact Us