
The Updated Neighborhood Atlas

Advisory ULI Terwilliger Urban Neighborhoods Header2 e1601081284179
October 12, 2023 Urban Housing Trends Suburban Housing

An Interactive Mapping Tool for Examining American Neighborhoods

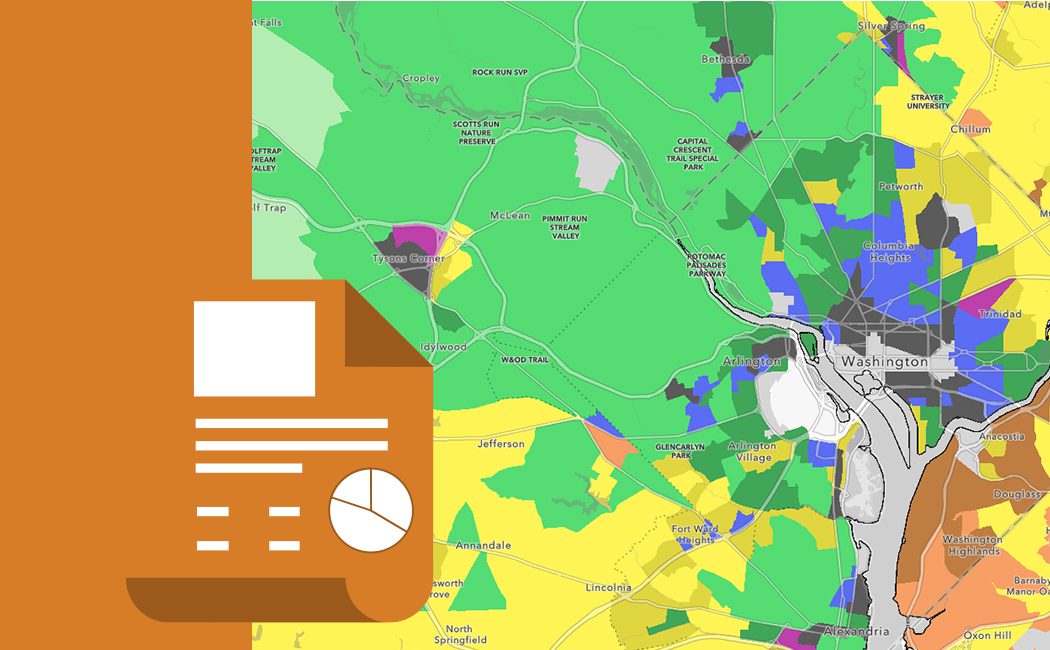
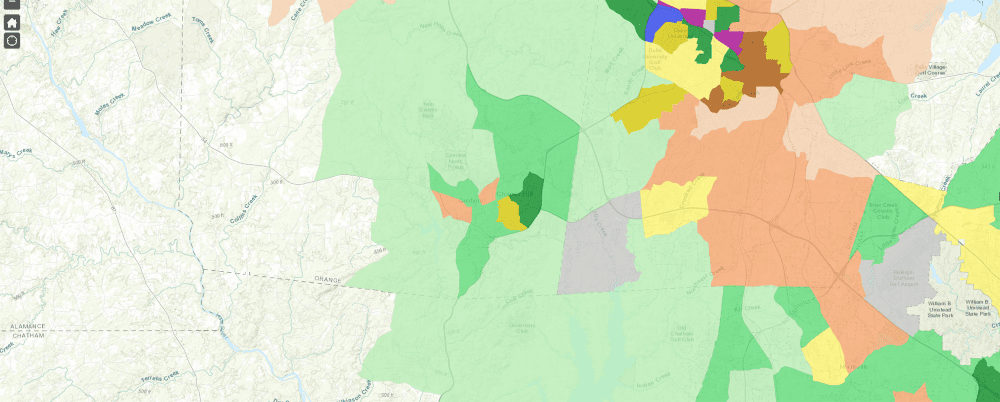
RCLCO is happy to announce an update and expansion to its Neighborhood Atlas. Originally created in conjunction with the ULI Terwilliger Center for Housing, the Neighborhood Atlas is an interactive map that sorts neighborhoods into one of 13 categories, ranging from “Rural” to “Economic Center.” Since its release in December 2016, the Neighborhood Atlas has attracted more than 32,000 page views, as real estate practitioners, academic figures, policy analysts, and others have used it to examine the communities in which they live, work, and play.

Today, RCLCO is releasing updated classifications, utilizing census tract boundaries from the 2020 Census and updated data through the end of 2022. The Neighborhood Atlas also covers a greater number of locations than ever before; in total, more than 70% of Americans now live in a neighborhood with a classification. Importantly, these classifications are just a single snapshot of these communities. In reality, neighborhoods are constantly evolving, as they experience such changes as urbanization, suburbanization, gentrification, and—in some cases—deterioration.


Much has happened since the last update of the Neighborhood Atlas in early 2020. A global pandemic has disrupted the ways that people live, work, and play, translating to countless changes at the neighborhood level. Central business districts that once bustled with office employees and business travelers are now grappling with the impacts of hybrid and virtual work environments. Conversely, many suburbs and smaller metropolitan areas experienced in-migration following the rise of these work environments.

Perhaps unsurprisingly, these changes are already apparent in the Neighborhood Atlas. In the 50 largest metropolitan statistical areas (“MSAs”), 80% of people now live in the suburbs, up from 78% in 2018. However, urban and suburban neighborhoods are now growing at roughly the same pace, potentially signaling a reversion to historical growth patterns. Other interesting takeaways from the updated Neighborhood Atlas include the following:

1.

American metropolitan areas are continuing to expand. Today, 96% of people who live in the 50 largest MSAs reside in urban or suburban neighborhoods, up from 94% just five years ago. During this time period, a significant amount of rural land has shifted to greenfield lifestyle and greenfield value suburbs, signifying the suburban fringes of these MSAs are continuing to expand.

2.

Urban and suburban neighborhoods experienced similar levels of growth from 2010 to 2020. During this time, the population of urban neighborhoods in the 50 largest MSAs grew by 9%, while the population of their suburban counterparts grew by 10%. However, the number of households grew at a faster pace in urban neighborhoods (13%) than suburban ones (10%), given smaller household sizes in higher-density areas. After years of urban outperformance, these trends suggest the pandemic-induced outflow of urban households to suburban settings offset the previous growth paradigm, resulting in balanced conditions for the decade as a whole.

3.

Population and household growth has returned to urban neighborhoods in the wake of the pandemic. While many of these neighborhoods faced population declines at the start of the pandemic, they have since bounced back. From 2020 to 2022, urban and suburban neighborhoods in the 50 largest MSAs saw their population and household bases grow at roughly the same pace (2%). During this two-year period, growth was most pronounced in economic centers, emerging economic centers, and mixed-use districts, signaling residents have returned to these neighborhoods as their employment and amenity bases have done the same.

4.

Rental apartment development has shifted to the suburbs since the start of the COVID-19 pandemic. In 2022, 58% of new apartment units in the 50 largest MSAs delivered in the suburbs, up from 53% in the five-year period leading up to the pandemic. At the same time, suburban apartment rents in the 50 largest MSAs grew by 25% from year-end 2019 to year-end 2022, outpacing the 20% growth in urban apartment rents. Of all neighborhood types, economically challenged suburbs and greenfield value suburbs saw the most robust rent growth during this period, highlighting growing demand for attainable rental housing, especially in suburban settings.

5.

The term “stable” is a misnomer when it comes to describing neighborhoods. Previously, RCLCO used the terms “stable neighborhood” and “stable middle-income suburb” to describe neighborhoods characterized by moderate densities, housing prices, and rent levels. However, a significant number of these neighborhoods have shifted toward their higher-end or more challenged counterparts over the last five years, prompting RCLCO to revisit its methodology for these neighborhoods and adopt new terminology to describe them. Today, RCLCO now refers to these neighborhoods as “middle-income neighborhoods” and “middle-income suburbs.”

Together, these trends highlight the changing landscape in American metropolitan areas. As always, the neighborhoods around us are continuing to evolve, and the Neighborhood Atlas remains a useful tool in understanding the extent to which they are doing so.

Disclaimer: Reasonable efforts have been made to ensure that the data contained in this Advisory reflect accurate and timely information, and the data is believed to be reliable and comprehensive. The Advisory is based on estimates, assumptions, and other information developed by RCLCO from its independent research effort and general knowledge of the industry. This Advisory contains opinions that represent our view of reasonable expectations at this particular time, but our opinions are not offered as predictions or assurances that particular events will occur.

Speak to One of Our Real Estate Advisors Today

We take a strategic, data-driven approach to solving your real estate problems.

Contact Us

Sign Up For Our Newsletter