March 19, 2026
An Interactive Mapping Tool for Examining American Neighborhoods
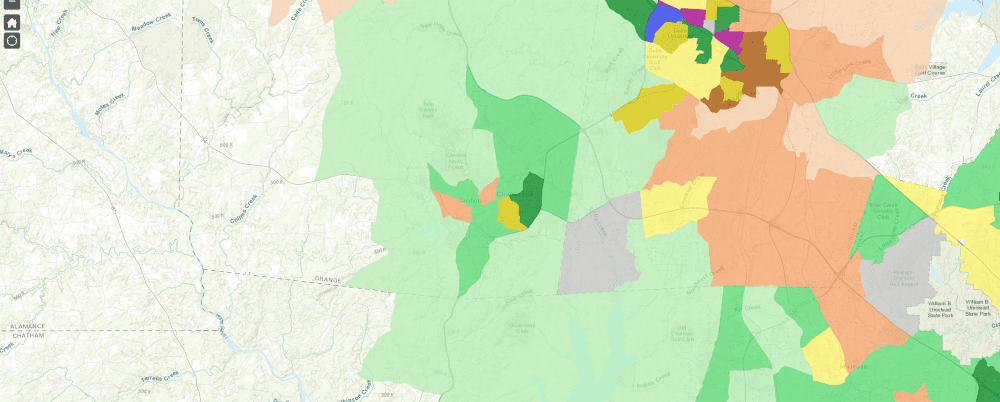
RCLCO is happy to announce an update to its Neighborhood Atlas. Originally created in conjunction with the ULI Terwilliger Center for Housing, the Neighborhood Atlas is an interactive map that sorts neighborhoods into one of 13 categories, ranging from “Rural” to “Economic Center.” The methodology is unique and useful because it categorizes places based on the nature of the real estate that exists within them.
Highlights we have observed based on the most recent update include:
- Population growth in urban neighborhoods slowed during and after the COVID-19 pandemic, with momentum shifting outward to greenfield and rural areas with more room to expand.
- In response, rental apartment development has pivoted away from urban neighborhoods and toward the suburbs.
- As new urban supply thins, urban neighborhoods are regaining an edge in rent growth—led by Economic Centers and Mixed-Use Districts.
RCLCO first developed the Neighborhood Atlas in 2016 to address the imbalance in how urban and suburban areas were being discussed and analyzed. At the time, suburbs were often portrayed as a single monolithic category, while most attention from the media, policymakers, and urbanists focused on the resurgence of urban neighborhoods. The Neighborhood Atlas aimed to add nuance to this conversation by highlighting the diversity, vitality, and ongoing transformation of suburban communities—places that continued to grow and evolve even as they were frequently overlooked in national discourse.
Since then, the narrative around American neighborhoods has shifted yet again. Once central to discussions of growth, urban areas faced unique challenges during the COVID-19 pandemic, which reshaped how people think about where they live and work. In the years that followed, population patterns changed, with renewed momentum in suburban and rural areas. The expansion of remote and hybrid work gave many households greater freedom to live farther from job centers, potentially reversing earlier patterns of urban concentration. As a result, public discourse swung in the opposite direction, with some observers predicting a decline—or even the “death”—of certain urban neighborhoods.
These shifting dynamics underscore the importance of the Neighborhood Atlas. While the pandemic did prompt changes in where people choose to live, the more hyperbolic predictions have not borne out. Both urban and suburban neighborhoods continue to grow, even as notable variations persist across regions and neighborhood types. With this latest update to the Neighborhood Atlas, several important insights emerge, including the following:
1.
Population growth has indeed slowed in many urban neighborhoods since the COVID-19 pandemic. Across the 50 largest MSAs, urban neighborhoods added an average of 70,000 residents per year from 2020 to 2025, down from 256,000 per year from 2010 to 2019. Suburban neighborhoods also saw a moderation in growth, though to a lesser degree. In contrast, rural neighborhoods saw an increase in average annual growth, as did several smaller metropolitan areas outside the 50 largest.
2.
However, growth patterns are not uniform across neighborhood types, and some of the densest urban neighborhoods continue to demonstrate impressive trajectories. In the 50 largest MSAs, economic centers and emerging economic centers are still expanding at healthy rates. In contrast, established high‑end suburbs, middle‑income suburbs, and economically challenged suburbs are now growing at half—or even less—of their previous pace. Growth has instead shifted toward greenfield suburbs and rural areas, as limited development capacity and other constraints in more “built‑out” suburbs has pushed suburban housing demand outward.
3.
Growth patterns also vary across regions, and the slower rate of urban growth is partly attributable to the fact that many of the most urbanized metropolitan areas are experiencing slower growth across all neighborhood types. Much of the disproportionately strong suburban growth in the 50 largest MSAs reflects the concentration of urban populations within New York and other major “Gateway” metropolitan areas, including Boston, Chicago, Los Angeles, Miami, Philadelphia, San Francisco, and Washington, D.C. Unlike more rapidly expanding Sun Belt, New West, and Heartland markets, these metropolitan areas tend to exhibit steadier, more modest growth across neighborhood types due to their well‑established employment bases, high living costs, and constrained housing inventories. Overall, more than half of all residents living in urban neighborhoods within the Top 50 MSAs reside in these metropolitan areas (58%), underscoring how slower growth in Gateway markets significantly shapes national patterns.
4.
The COVID‑19 pandemic marked a shift in institutional rental apartment development patterns. In the five years leading up to the pandemic, urban and suburban neighborhoods in the 50 largest MSAs added similar numbers of rental apartments each year—roughly 98,000 and 112,000 units, respectively. However, suburban apartment development has since surged, while urban development has slowed; in the 50 largest MSAs, suburban neighborhoods added 184,000 rental units in 2025, compared with just 70,000 in urban neighborhoods. After several years of concern about oversupply in many urban neighborhoods, this pullback is likely to help rebalance conditions and position urban markets for renewed investment opportunities as demand continues to recover and new supply pipelines thin out.
5.
Possibly a result of this shift, urban neighborhoods are now outpacing suburban ones in rent growth—a reversal of trends seen during and immediately after the pandemic. Across the 50 largest metropolitan areas, nearly all neighborhood types experienced above-average rent growth in 2021 and 2022, driven by limited housing supply and unusually strong demand. Since then, rent growth has cooled as new supply has come online and demand has softened amid broader economic headwinds. Even so, urban neighborhoods are seeing slightly stronger annual rent growth (0.6%) than suburban neighborhoods (0.3%), partly reflecting the slowdown in new urban construction. Economic centers and mixed-use districts rank among the strongest performers overall, while greenfield value suburbs and economically challenged suburbs are also posting above-average growth—indicating rising prices even in traditionally more affordable areas.
As urban and suburban dynamics grow increasingly complex, tools like the Neighborhood Atlas are becoming essential in helping stakeholders understand the realities on the ground. Rather than relying on sweeping generalizations, it is more important than ever to recognize the diverse and evolving trajectories of neighborhoods across the urban-suburban spectrum.
Neighborhood Atlas Methodology & More Interactive Data
The RCLCO Neighborhood Atlas: Methodology
Housing Progress Interactive Index
Interactive Map of the Top-Selling Master-Planned Communities: 2013-2022