2017 STEM Job Growth Index

As Featured on CNBC’s Halftime Report – click to watch.
The Rise of STEM
As we approach the end of 2017, STEM (an acronym for science, technology, engineering, and mathematics) jobs continue to dominate growth in the United States employment markets. Between 2005 and 2015, STEM employment grew by 24.4%, over five times more than non-STEM employment over the same period. As technology continues to expand into every aspect of our lives, STEM occupations, with their better wages (average STEM-employment wages are 29% higher than non-STEM employment wages) and lower unemployment rates (average unemployment in STEM fields is 2.5%, compared with 5.5% for non-STEM employment), attract a wide range of labor—with significant implications for economic development and real estate.
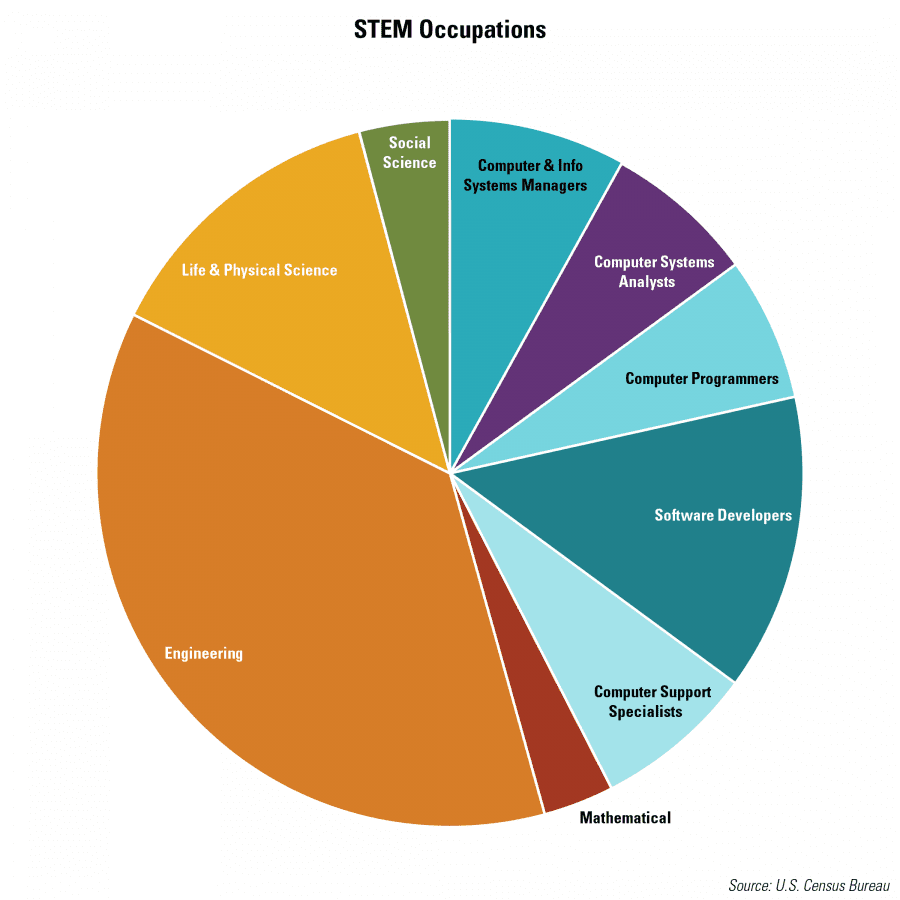
We hear about “STEM jobs” all the time in today’s workplace, but it is helpful to better define and outline the types of jobs that make up this growing industry segment. About 50% of STEM jobs are explicitly computer-related, including computer and information systems management, programmers, software developers, and other computer support specialists. Mathematical, engineering, life and physical science, and social science occupations comprise the other half of STEM jobs.
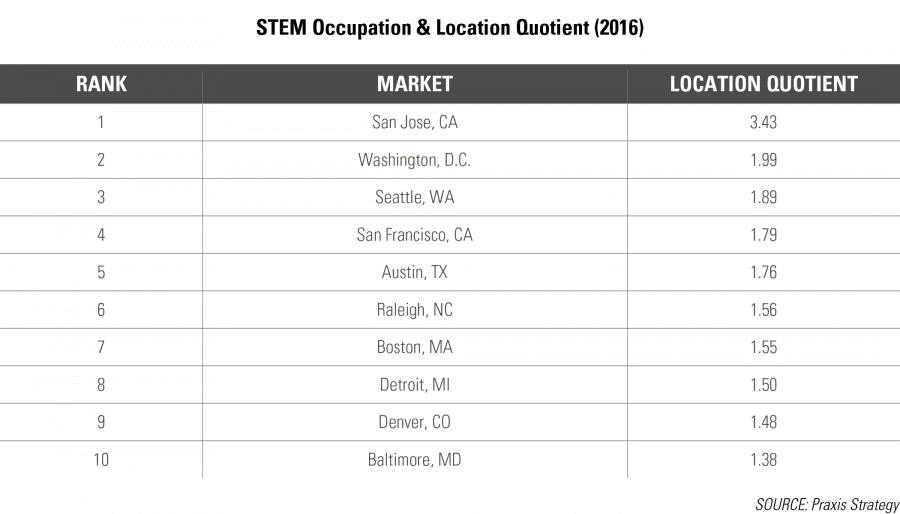
The top five markets with the highest relative concentration of STEM jobs are San Jose; Washington, D.C.; Seattle; San Francisco; and Austin, a somewhat predictable list given that these markets are (or have become) home to many of the nation’s largest tech companies, including Google, Amazon, Apple, and Microsoft. However, the next tier of STEM-oriented markets shows more diversification. In addition to markets such as Raleigh, Boston, and Denver, we see high concentrations of STEM jobs in perhaps unexpected markets such as Detroit and Baltimore.
The recent announcement that Amazon is seeking a location for its “HQ2,” and the subsequent flurry of proposals from cities hoping to land Amazon’s planned 50,000 high-paying jobs, have dominated headlines over the last month. While only one city will be able to receive the crème de la crème of STEM economic development opportunities, STEM jobs will experience significant growth across many markets, at many different companies, in coming years. According to the Bureau of Labor Statistics, STEM employment is projected to grow by 8.9% annually through 2024, aided in part by the growing popularity of STEM related majors at universities. As STEM workers continue to drive innovation and outpace traditional employment growth, tracking and understanding STEM employees’ and employers’ motivations for choosing where to locate will be fundamental in understanding which markets are poised to experience significant growth in the coming years.
The 2017 STEM Job Growth Index
RCLCO partnered with CapRidge Partners, an office investment management firm, to create the 2017 STEM Job Growth Index (“STEMdex”) as a tool to identify which markets are primed for growth in STEM-based industries. Building on the framework used when creating the first iteration of the STEMdex in 2016, our analysis focused on metrics in four major areas RCLCO finds to be paramount to the growth of STEM jobs: Workforce Quality, Cost of Doing Business, Economic Growth, and Quality of Life. In total, we analyzed 29 different indicators that we believe best characterize the four major categories and would allow us to quantify their impact on the STEM job market. Each indicator was assigned a weighting based on its projected relative importance to the STEM job market; in aggregate, these metrics were combined to create our STEM index rankings for 2017.
Where do they rank?
What’s Changed?
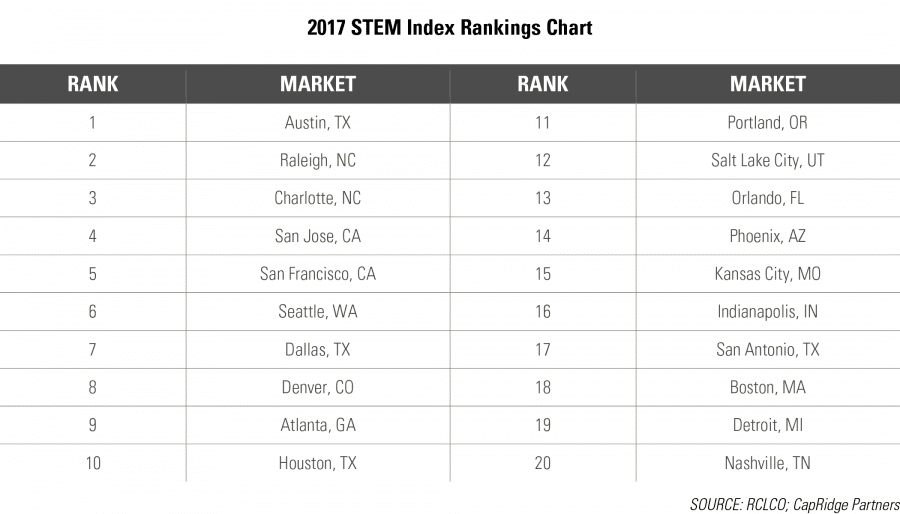
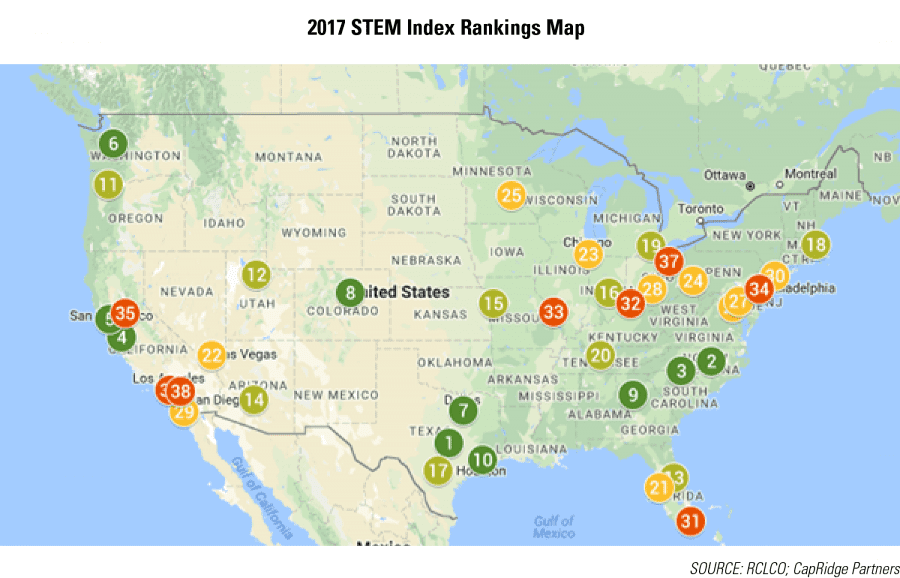
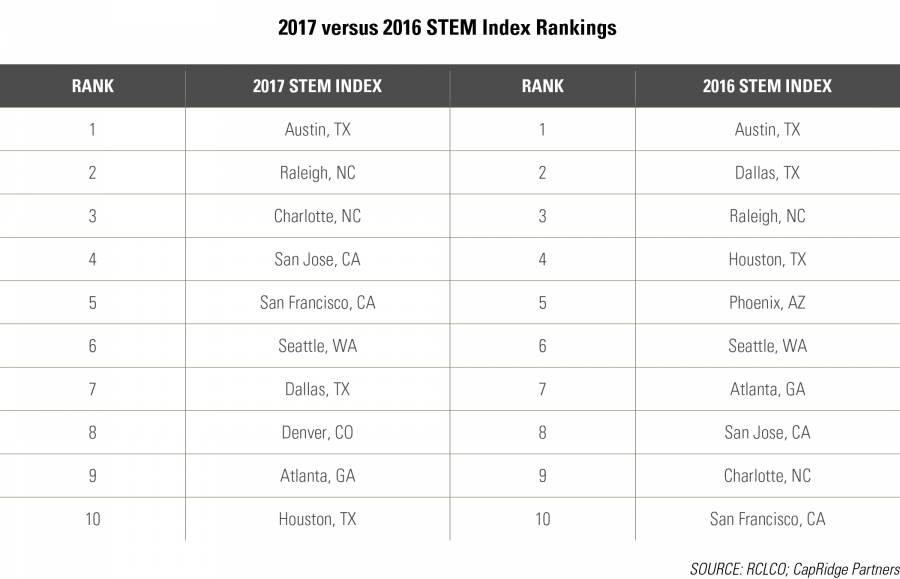
Although the methodology and indicators used in the 2017 STEM index model vary slightly from last year, nine of the same markets remain in the top 10, albeit in a different order, with Denver taking over Phoenix’s spot in the top 10. Obvious STEM hotspots, such as San Jose and San Francisco, rank near the top of our list, as they continue to offer employers the deepest labor and talent pools. However, the highest-ranking markets, namely Austin, Raleigh, and Charlotte, provide not only growing concentrations of STEM and advanced industries jobs, but also more favorable business conditions. Houston, which fell six spots, ranked highly in 2016 due to its strong STEM occupational growth over the past decade. In the past two years, however, due in part to the volatility of the energy markets, Houston’s STEM occupational jobs have stagnated and actually decreased slightly. Phoenix, the only market to fall out of the top 10, while ranking strongly in cost of doing business and quality of life categories, has struggled to attract younger STEM workers to the area. Denver, on the other hand, has catapulted into the top 10, largely because of its high level of millennial population growth.
Takeaways
Major Players Likely to Remain
Markets that have seen the largest growth in STEM employment (San Jose, Seattle, and San Francisco) have also seen increases in the cost of living of similar magnitude, with average multifamily rents in these markets increasing by between 25% and 75% since 2010.[1] In spite of these astronomical increases in rents, major employers and employees alike continue to flock to these markets due to the agglomeration benefits associated with locating near major research institutions and large tech companies, which provide a large supply of labor in a centralized local area, as well as access to new innovation and capital. Moreover, employees are attracted to industry clustering as it provides them the opportunity to change jobs without necessarily having to move to a different city. While both cost of doing business and cost of living may ultimately be limiting factors for these markets’ continued growth in STEM employment, it is difficult to imagine a scenario in which major companies don’t at least maintain their flagship presence in these markets.
Rise of the Low-Cost, Business-Friendly Markets
Austin, Raleigh, and Charlotte rank atop the STEM index for 2017. As previously mentioned, these markets provide not only growing concentrations of STEM and advanced industries jobs, but also better business conditions. In addition to lower costs of housing, they are in states that have more business-friendly tax structures and better fiscal health, reducing business tax burdens and actually allowing them to attract new businesses into the area. These markets also feature “hip” urban cores and the presence of large universities that help to attract and retain younger workers. While housing costs, an important consideration for STEM workers who are looking to start families, have risen in these markets dramatically over the last five years, these markets are still bargains compared with San Francisco, Seattle, and San Jose. As these markets continue to build momentum in establishing their own industry clusters, like the rising tech scene in Austin and financial service clustering in Charlotte, it is likely that these markets will capture an even larger share of STEM employment growth.
Employees Ultimately Have to Want to Live There
Various markets may boast low costs of living and favorable business climates, but they may ultimately struggle to capture a large share of future employment growth if they can’t provide attractive environments for employees to live and start families. Due to the intense competition for talent, in STEM in particular, businesses consistently mention access to talent as the primary driver in location selection decisions, even leading them to remain in locations with less favorable business climates. It is therefore key for markets hoping to attract these 21st century jobs to evaluate their attractiveness to young, educated individuals and households relative to quality of cultural and recreational opportunities, the natural environment, educational systems, commuting infrastructure, and so on.
Conclusions
By this time next year, Amazon will have selected its market for “HQ2,” giving us an excellent opportunity to evaluate the drivers of a major tech company’s site selection decision in a relatively transparent way. This case study may allow us to revisit our index and evaluate how relevant the metrics we use continue to be (at least for one company). As both costs of living and doing business continue to increase in established tech markets, the decisions of where businesses looking for low-cost, high-talent markets choose to locate, and employees looking to maximize their quality of life choose to live, will become an increasingly important.
CNBC Halftime Report: CapRidge Partners Tracking STEM jobs to invest in real estate
Steve LeBlanc, CapRidge Partners founding partner, discusses how he uses this proprietary “STEMdex” to find real estate opportunities. Watch the CNBC segment online here.
Article and research prepared by Taylor Mammen, Managing Director, and Kyle Ruane, Senior Associate.
References
[1] Axiometrics rental growth in San Jose, Seattle, and San Francisco from 2010-2017 YTD.

RCLCO’s mission is to help clients make strategic, effective, and enduring decisions about real estate. In 2017, we celebrate 50 years of providing the best minds in real estate with cutting-edge analytics, actionable advice, and the highest level of customer service. Our work includes market, economic, financial, and impact analyses; investment portfolio strategy and implementation; entity-level strategic planning; and management consulting.
Disclaimer: Reasonable efforts have been made to ensure that the data contained in this Advisory reflect accurate and timely information, and the data is believed to be reliable and comprehensive. The Advisory is based on estimates, assumptions, and other information developed by RCLCO from its independent research effort and general knowledge of the industry. This Advisory contains opinions that represent our view of reasonable expectations at this particular time, but our opinions are not offered as predictions or assurances that particular events will occur.
Related Articles
Speak to One of Our Real Estate Advisors Today
We take a strategic, data-driven approach to solving your real estate problems.
Contact Us